
/Health20%2010-12.ppt
Before you start reading, download the document above. It’s a single PowerPoint slide that’s animated to build. Go into presentation mode, then read along with the narrative below.
A Broad Vision of Health 2.0
Reformulating Data for Transparency, Decision Support & Revitalized Health Care Markets
Brian Klepper and Jane Sarasohn-Kahn
The term Health 2.0 refers to the concept, described by O’Reilly, of Web-based platforms that allow users to reformulate data for their own purposes. The Health 2.0 movement is rapidly gaining steam and traction, propelled by established and startup firms. The efforts displayed at the recent Health 2.0 meeting in San Francisco, convened by Matthew Holt and Indu Sabaiya, were both wide-ranging and narrowly focused. Even so, several end-of-day panelists noted that, at this early stage, Health 2.0’s definitions and translations into practice remain murky and fragmented.
We thought it might be useful to try to develop an image of how Health 2.0 MIGHT develop: what its working parts were, what kinds of information it would receive and generate, who its users would be and what its impacts might be. The image that has resulted is simplistic; it doesn’t try to explore any of the underlying mechanisms necessary to pull this off. But it does try to convey a vision of how innovators might come together to aggregate and reformulate large data sets from disparate sources to create tremendous new utility in the marketplace for patients, clinicians and purchasers of all types.
We are posting this image on the various sites where we write – others are welcome to post it as well – as an exercise. Where is the structure wrong? What are we missing? How can this be made clearer, stronger, more faithful to our best hopes for where health information management might take us? Let us hear from you, and we’ll update the image as we collectively think through the issues involved.
One caveat. Please note that we have not included back-office operational functions in this chart. While it is entirely possible that these too will ultimately be managed through Web-based processes, they are by definition the most proprietary business management tools and therefore the least susceptible to sharing.
Thanks much for working with us on this.
Now let’s look at what we have so far. Open the PowerPoint file and go into presentation mode. At the top you should see the title, “A Broad Vision of Health 2.0,” and the subtitle “Reformulating Data for Transparency, Decision Support & Revitalized Health Care Markets.” Our names are listed at the bottom left.
Now click once (or you can hit the space bar or the right arrow), and the first element should appear. These are:
The Data Sources – claims, clinical encounter data, drug, lab, image – that can be captured and mapped to a common format, like ASTM’s Continuity of Care Record (CCR). (click)
A Centralized Data Repository (CDR), which is designed to receive, aggregate and securely house large data sets. (click)
Above the CDR are several Tools, each focused on a different health care stakeholder. We’ve listed four big ones here, in descending order from the center of the system (that is, the consumer/patient) downward. First is a Vendor Management tool to help purchasers manage vendors. The term “vendor” is used very broadly here, because, in the continuum of care, nearly everyone is a purchaser, vendor, or both. Employers buy health benefits from health plans that in turn contract with doctors, hospitals and other care providers. Doctors and hospitals buy drugs, devices, supplies and many other products and services, and so on. One of health care’s most vexing problems has been that most purchasers have had very little information to help them decide which products and services offer the best value. As Health 2.0 creates greater pricing and performance transparency for products and services, as well as decision support tools that can help purchasers make sense of complex information, these forces may go far to help health care work as a functioning market, driving tremendous new efficiencies and smarter purchasing decisions.
Individualized data flow from the CDR to the Electronic Health Record (provider-oriented) and Patient Health Record (consumer/patient-facing). Once analyzed, individualized and de-identified data flow from the CDR to the appropriate tools. (See below.) (click)
Next are the Health Management tools that will be used by health care professionals who manage patient care outside clinical settings. These might include the staffs in demand, case, disease and wellness management operations, whose interventions are focused on (1) monitoring health status and the vectors that impact it, (2) cultivating positive behavioral change and, (3) coordinating the care delivered by constellations of clinical providers. (click)
The Electronic Health Record (EHR) is the hub of patient management within the clinical setting, and should be understood here to be not only an expansive repository of patient information (ultimately with room for gene maps, family histories and information about alternative care maps), but a complex of tools that includes clinical decision support, health plan rules, product/service pricing, and so on.(click)
The Patient Health Record (PHR) is a lay reflection of the more robust EHR, with linkage to tools that are aimed at the consumer’s self-management, including guidance on when to seek professional expertise. (click)
Analytics are applied to the data in the CDR to reveal patterns, to evaluate patients’ health status, and to identify the desirability of different clinical and vendor choices. For example, the:
o Relative pricing and performance within and across regions of physicians by specialty, and hospitals by services,
o Relative pricing and performance of drugs and devices within class and by vendor.
o Identification of patients with specific risks.
o Identification of more or less effective diagnostic and treatment pathways.
There are several well-accepted, widely-used analytical classification and risk adjustment tools in the market, e.g.: ETGs, CRGs and DxCGs. These algorithms permit unbiased comparisons among providers, patients and treatments and facilitate identification of patients at risk, as well continuous updating of clinical and administrative best practice.
These tools allow decision-makers of all types to evaluate professionals, organizations, products and services in the marketplace. So it is critical that all health care stakeholders find the analytical processes trustworthy, credible and open to scrutiny. This is why it is so important that the methods used to achieve transparency be transparent as well. (click)
Now comes the first result of the analyses, Identifying Patients At Risk. These might be patients identified with chronic conditions; they could also be patients with signs or symptoms predicting genetic anomalies or acute conditions. Information about the patients identified during this process would be forwarded to their EHRs and PHRs, as well as to the Health Management tool, so they can be contacted and, possibly, receive health interventions. (click)
By receiving a continuous flow of data, by constantly watching for best clinical and financial outcomes for specific conditions and purchasing processes, and by working “backwards” to identify the common pathways that led to those outcomes, the analytical tools could presumably Identify Best Practice Guidelines. These, in turn, could be passed along to and embedded in the EHRs, Health Management and Vendor Management tools, each in formats that make sense to the tools’ different users. This becomes a continuous improvement process. (click)
The third major result of the analytics, Pricing/Performance Transparency compares the relative pricing and performance of four major health care product/service classes: Providers, Payers, Products (Drugs, Devices, Equipment and Supplies), and Interventions/Treatments. (click)
The information produced by the Pricing/Performance Transparency functions are distributed into two ways. First, they become readily available to stakeholders of all types through Public Reports, distributed by the host or by any other public or private group, and made available through the tools to purchasers, health managers, clinicians and patients. Again, to be credible, public reporters must be scrupulous and transparent in their evaluation methodologies. (click)
The findings of the various Pricing/Performance analytics can also flow into constantly updated Decision-Support Tools, which are adapted to the needs of purchasers, health managers, clinicians and patients. (click)
Decision Support is also informed by input from Expert Content – e.g., current knowledge on efficacy and value from the health care literature, medical encyclopedias, and best practice guidelines. (click)
Finally, the PHR and patient decision-making are enhanced by User-Generated Content, guidance from patients and caregivers who have dealt with the condition in question, information about health or treatments that might not be contained in the current record, individualized search results, and other relevant information.
It is not difficult to imagine that, as these various functions come together and are integrated into continuously refined applications, the impacts on the health care marketplace could be profound. The inability to see and know the results of health care processes has created an opportunistic culture that pervades every part of the continuum. The unprecedented transparency that will result from these, as well as the decision-support capabilities for patients, clinicians, health managers and purchasers, should go far in finally helping health care begin to adhere to the same rules that govern other markets. When stakeholders can make informed decisions, based on solid data, the impacts on cost and quality could be transformational.
Some key questions remain. Does this model represent what is possible and likely to occur? Can the organizations working to integrate these functionalities access the data required, and will they be capable of developing or acquiring the various processing elements incrementally? Will certain stakeholders, knowingly or tacitly, work against the ultimate objectives of this model?
We’re optimistic, but time will tell.
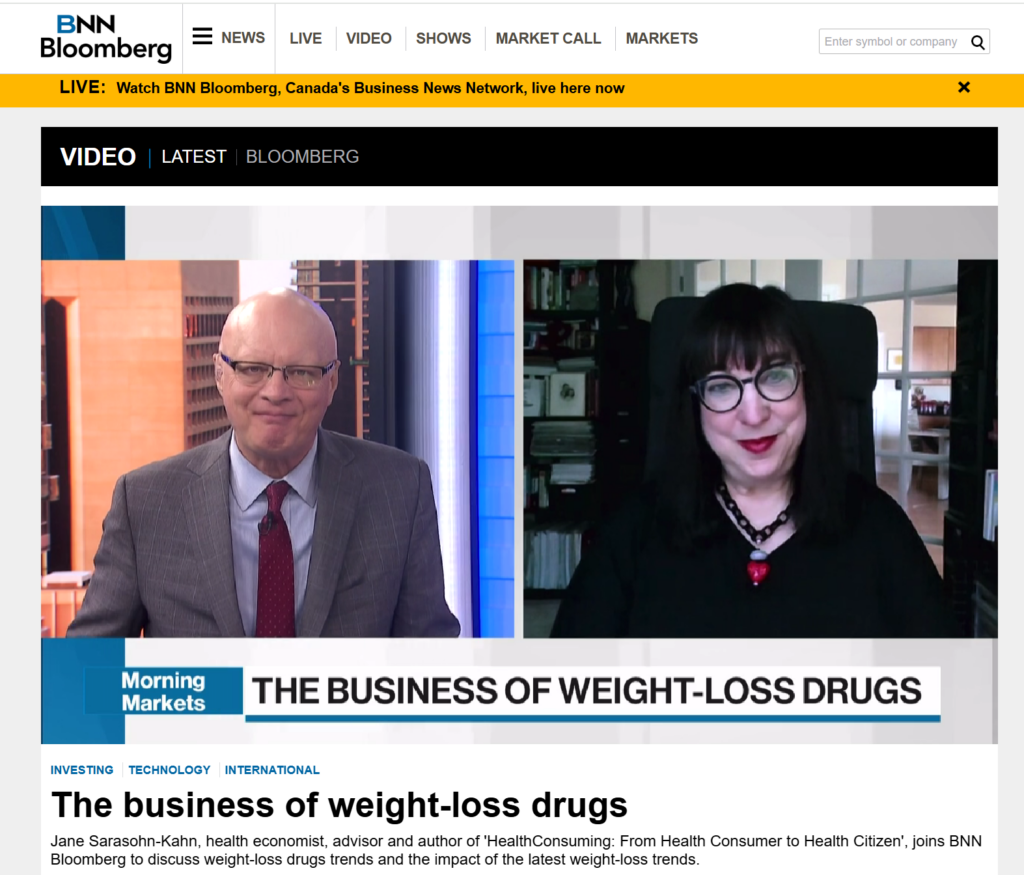 Interviewed live on BNN Bloomberg (Canada) on the market for GLP-1 drugs for weight loss and their impact on both the health care system and consumer goods and services -- notably, food, nutrition, retail health, gyms, and other sectors.
 Thank you, Feedspot, for
  As you may know, I have been splitting work- and living-time between the U.S. and the E.U., most recently living in and working from Brussels. In the month of September 2024, I'll be splitting time between London and other parts of the U.K., and Italy where I'll be working with clients on consumer health, self-care and home care focused on food-as-medicine, digital health, business and scenario planning for the future...