
 Cue up the song “Hey Big Spender” from the Broadway hit, Sweet Charity, when you read the January 2012 AHRQ report with the long-winded title, The Concentration and Persistence in the Level of Health Expenditures over Time: Estimates for the U.S. Population, 2008-2009.”
The report’s headline is that 1% of the U.S. population consumed 20% of all health costs spent in the U.S. in 2008 and 2009, illustrated by the chart. These Big Health Spenders tend to be in poor or fair health, older, female, non-Hispanic whites and people with only publicly-provided health insurance. Their mean expenditure was $90,061.
The top 10% of U.S. health citizens accounts for nearly two-thirds of health spending in the U.S., with a mean expenditure of $23,992.
Not surprisingly, the small spenders tend to be younger, in excellent health, men, Hispanics, and — drum roll — the uninsured.
Data for this study come from the Medical Expenditure Panel Survey (MEPS-HC) for 2008 and 2009, a nationally representative poll that collects information in U.S. health care utilization and spending, health insurance, and health status, along with demographics for the U.S. civilian, non-institutionalized population. See more about MEPS-HC at http://meps.ahrq.gov/mepsweb/data_stats/download_data_files.jsp.
Health Populi’s Hot Points: Bending that stubborn, ever-increasing cost-curve of U.S. health spending is Job #1 for managing the long-term health of America’s economy — with particular attention to be paid to Medicare spending reform. That 1% of U.S. health citizens account for $1 in $5 of health spending means we can target these efforts pretty well — if we begin to pay for care beyond “the visit,” “the encounter,” and “the test.”
That speaks to paying for bundles, for performance, for outcomes.
A report from the McKinsey Center for U.S. Health System Reform, published in December 2011, talked about Accounting for the cost of U.S. health care. The report points out that every spending category grew faster than GDP between 2006 and 2009 except for health administration and insurance. Outpatient care costs rose by over 6% each year, and is the single-largest spending category — representing one-half of all the growth in U.S. health expenditures in the four years. That’s over one-billion dollars a year, and was $522 billion (yes, billion) greater than Estimated Spending According to Wealth (ESAW), a metric derived from regression analysis based on a nation’s per capita income and spending data from comparable OECD member countries. That $522 bn is equivalent to about 20% of U.S. total health expenditures each year.
Outpatient care includes services provided in doctors’ offices, freestanding clinics, outpatient surgery, diagnostic imaging centers, ambulance services, and dental care.
 Digging further into the ESAW outpatient data point, McKinsey found that the fastest-growing spending sources for outpatient care were Medicaid and other state programs (at 9.4% per CAGR) and Medicare (8.5% CAGR), compared with private payors increase of 4.9% CAGR.
Talk about Sweet Charity.
Incentives built into paying for performance and outcomes would compel providers to change workflows and processes that would engage people more in self-care at home and on-the-go. The proliferation of novel self-tracking devices for health at last week’s 2012 Consumer Electronics Show are a signal that we are at the starting gate of health citizens potentially using these technologies. Greater health engagement would surely enable people to participate more fruitfully in their own health and care for their loved ones. But as Bill Walsh from AARP said in a discussion on ‘who will pay?’ for connected health devices, we fail to realize the low level of awareness of these devices among consumers. So we’ve got education and incentive-building to do for both providers and patients before we get to the Holy Grail of Connected, Participatory Health, and our ability to impact health care cost increases.
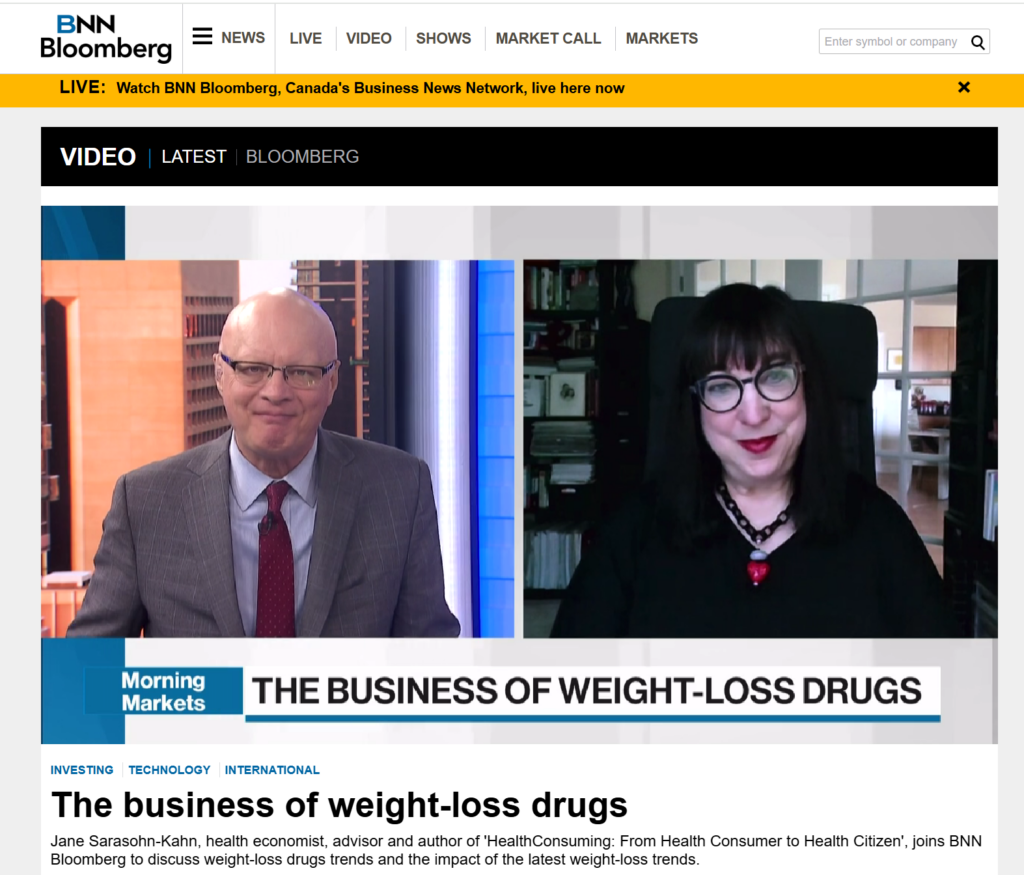 Interviewed live on BNN Bloomberg (Canada) on the market for GLP-1 drugs for weight loss and their impact on both the health care system and consumer goods and services -- notably, food, nutrition, retail health, gyms, and other sectors.
 Thank you, Feedspot, for
  As you may know, I have been splitting work- and living-time between the U.S. and the E.U., most recently living in and working from Brussels. In the month of September 2024, I'll be splitting time between London and other parts of the U.K., and Italy where I'll be working with clients on consumer health, self-care and home care focused on food-as-medicine, digital health, business and scenario planning for the future...