
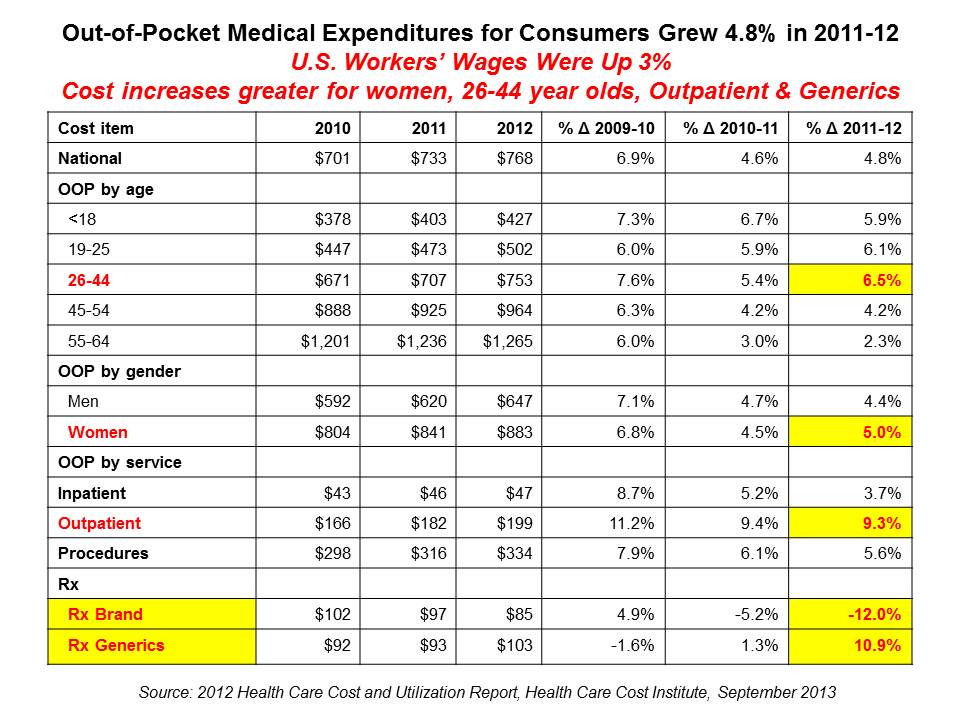
 U.S. health consumers faced greater out-of-pocket health care costs in 2012, especially for outpatient services (think: doctors’ visits) and generic drugs, as presented in The 2012 Health Care Cost and Utilization Report from the Health Care Cost Institute (HCCI) published in September 2013.
At the same time between 2011 and 2012, wages grew about 3%, remaining fairly flat over the past decade as health care costs continued to grow much faster.
HCCI found that per capita (per person) out-of-pocket growth for outpatient visits amounted to an average of $118 between 2011 and 2012.
But the biggest share of out-of-pocket costs for consumers is professional procedures (e.g., surgeries, outpatient procedures), taking up 43% of total OOP spending per American, split as follows:
- Procedures, 43%
- Outpatient faciliities, 26%
- Prescription drugs, 25%
- Inpatient facilties (hospitals), 6%.
In 2012, the proportions for outpatient vs. Rx have flipped – in 2011, Rx spending was marginally greater than outpatient costs.
Health Populi’s Hot Points: See the chart which I’ve assembled from the HCCI data. The yellow-highlighted boxes tell the outlier stories that are the headlines for Health Populi: that health care costs grew faster for…
- Women
- People age 26-45 (Gen X – stay tuned for new data from HealthcareDIY launching October 8 2013 talking about Gen X as the new, younger sandwich generation)
- Generic drug costs grew double-digits while branded Rx costs fell.
This is new-news for a lot of people, and a surprising jolt from generic drug costs. While on a per-prescription basis some generics for maintenance meds can cost as little as $4 for a 30-day supply, watch this space. The U.S. health economy may have wrung out as much generic drug cost savings as it can by 2013 and beyond.
 One of the best aspects of my work is collaborating across the health/care ecosystem to address how health citizens can deal with health care costs and and care for families. I'm grateful to have collaborated with Fidelity on their research into this issue,
  Jane joined host Dr. Geeta "Dr. G" Nayyar and colleagues to brainstorm the value of vaccines for public and individual health in this challenging environment for health literacy, health politics, and health citizen grievance.