
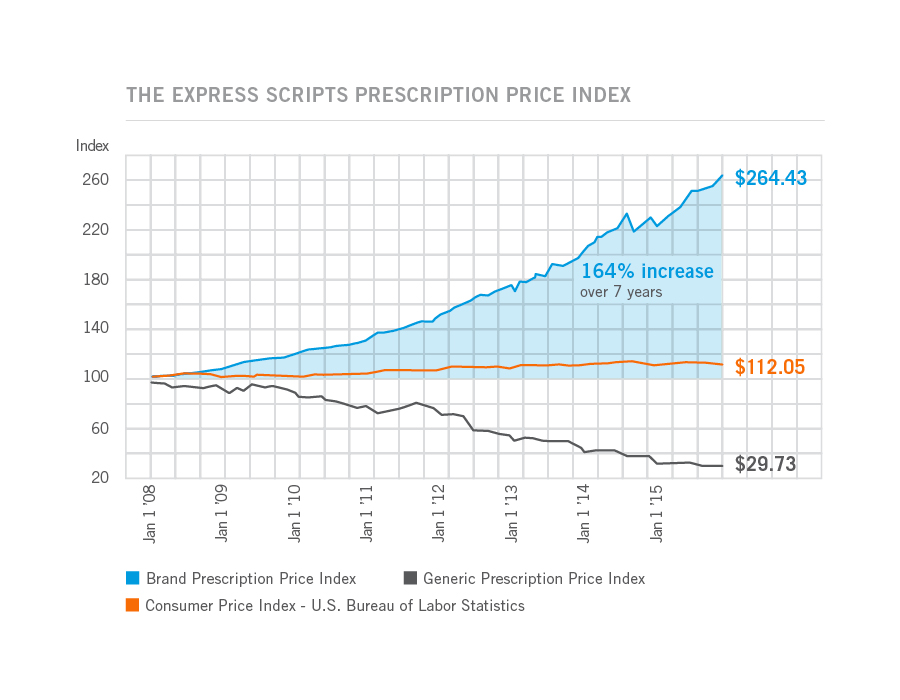
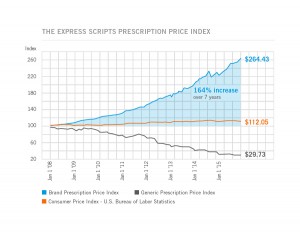
Prices for the most commonly used branded prescription drugs grew from a base index of $100 in 2008 to to $264 in 2015, based on the Express Scripts 2015 Drug Trend Report. This is illustrated by the upwardly-sloping blue line in the chart.
In contrast, the market basket of the most commonly used generic drugs fell from the $100 index in 2008 to $29.73, shown by the declining black line in the graph.
The $112.05 is calculated from a market basket of commonly purchased household goods which cost $100 in 2008, a relatively flat line which puts the 264% rise in the branded Rx index in context for an American household.
The Express Scripts Lab, part of the pharmacy benefit management (PBM) company, published the 133-page drug trend report which reviews 2015 prescription drug spending in great detail. The report summarizes key factors driving drug spend in 2015 (including higher prices for new products addressing oncology and high cholesterol), price inflation (addressed above, and calling out Novartis’s Gleevec which started at $25.50 in 2005 for a 100mg tablet, and rose to $112.37 in 2015), and the role of captive pharmacies (owned/operated by pharmaceutical manufacturers, such as the notorious Valeant-Philidor arrangement).
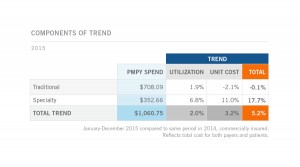 Overall, drug trend (defined as the growth in medicines spending year-over-year per member per year) was 5.2% in 2015 over 2015. One way to understand drug trend is to open the kimono and differentiate between utilization (volume) and unit costs. 2.0% of spending growth was due to utilization (volume of prescriptions) and 3.2% attributable to unit cost increases, shown in the table. Open that kimono further and segment traditional Rx from specialty drugs: while utilization of traditional prescription drugs grew a mere 1.9% in 2015 and unit cost fell 2.1%, the volume of specialty drugs increased 6.8% and their unit cost grew, 11%.
The top ten therapy classes in traditional drugs for commercially insured people by per member-per month spending included diabetes, pain/inflammation, high blood cholesterol, attention disorders, high blood pressure and heart disease, heartburn/ulcer, mental/neurological disorders, asthma, compounded drugs, and skin conditions. Spending for the heartburn/ulcer category grew the fastest, at 35.6%, in 2015, driven primarily by new expensive branded products including Nexium (which became generic in February 2015), Dexiland, and Prevacid. Diabetes continues to be a key driver in drug trend (led by Lantus, Humalog, and Januvia in the top ten traditional therapies), with both higher utilization and higher unit cost in 2015, due in major part from a lack of generics in this category.
The top ten therapy classes for special drugs included inflammatory conditions, multiple sclerosis, oncology, Hepatitis C, HIV, growth deficiency, cystic fibrosis, pulmonary hypertension, hemophilia, and sleep disorders. The top 3 of these categories accounted for 56% of all specialty drug spending. Humira and Enbrel for inflammation, Harvoni and Viekira Pak for Hep C, and Copaxone, Tecfidera, and Gilenya for MS were among the most prescribed specialty Rx brands in 2015.
The report details for each class trends and forecasts.
One new focus in the report is looking at Health Insurance Exchange market trends for prescription drug spending. Overall drug trend for the exchange population was 14.6%, higher than the commercial, Medicare, or Medicaid plan populations. This was driven, overall, more from utilization (volume) than unit costs, although unit costs for specialty meds increased similarly to the commercially insured population. The growth in the utilization is due to new entrants into the health system having access to care — filling previously unmet needs.
On the specialty drug front for exchange plan members, note that the top therapy classes were for HIV, Hep C, inflammation, oncology, and MS. The top brands here were Harvoni and Sovaldi for Hep C; Atripila, Atribild, Truvada, and Complera for HIV; and, Humira and Enbrel for inflammatory conditions.
Health Populi’s Hot Points: Diabetes continues to be the most expensive (non-specialty) drug category, with an increase of 14% overall, driven by both utilization and unit cost. As a health condition amenable to lifestyle changes, providers taking a broader social-determinants-of-health approach to Type 2 Diabetes would surely move the needle on health care costs — both for prescription drugs and for health services utilization, both inpatient and outpatient. As providers take on more value-based reimbursement for population health in diabetes, this approach, coupled with data analytics, will help consumers better self-manage and move their own needle on household/personal health care costs.
Specialty drug costs will continue to be a mighty contributor to health care spending, more-than-inching up towards becoming 20% of national health spending in the U.S. by 2020. In 2015, specialty drug trend was 37 over 2014, and in 2018 is forecast to be 50%, Express Scripts projects.
As consumers continue to take on financial risk as payors for health care, transparency and value “beyond the pill” will become crucial features for bio-pharma companies to develop to build trust, medication adherence, and patient-centered care in the value-based world.
 Thank you
  Jane joined host Dr. Geeta "Dr. G" Nayyar and colleagues to brainstorm the value of vaccines for public and individual health in this challenging environment for health literacy, health politics, and health citizen grievance.