
 Where you live is a determining factor in whether you have health insurance.
The darker green on the map illustrates states with the highest percentage penetration of people with private health insurance among people under 65. Note the concentration in the Upper Midwest, scattered Midwest, and bits of the northeast. It’s also helpful to live in Utah when it comes to health insurance coverage.
The lowest proportions of privately insured Americans are in much of the south, from Florida west to Texas and into southern New Mexico, Arizona and much of California.
The Urban Institute has studied health insurance coverage across Congressional districts and concludes that, indeed, geography is destiny. The Institute’s report, Variation in Insurance Coverage Across Congressional Districts, analyzes data from the 2008 American Community Survey, part of the U.S. Bureau of the Census data collection activities.
The bottom line is that private health insurance coverage is lowest in districts that have higher poverty rates.
Health Populi’s Hot Points: This second map illustrates the rate of uninsurance in each state. The darkest red represents the highest levels of uninsurance among people under 65. It’s clear these areas of highest uininsurance bleed from the south westward all the way up to the Canadian border.
The Institute punctuates its report with the conclusion that certain Congressional districts “would have the most to gain from health reforms that are designed to increase health insurance coverage toward a higher and more uniform national standard.”
This is one of the arguments for universal coverage: that Americans, regardless of geography or socioeconomic status, should have access to at minimum, a basic market basket of health services.
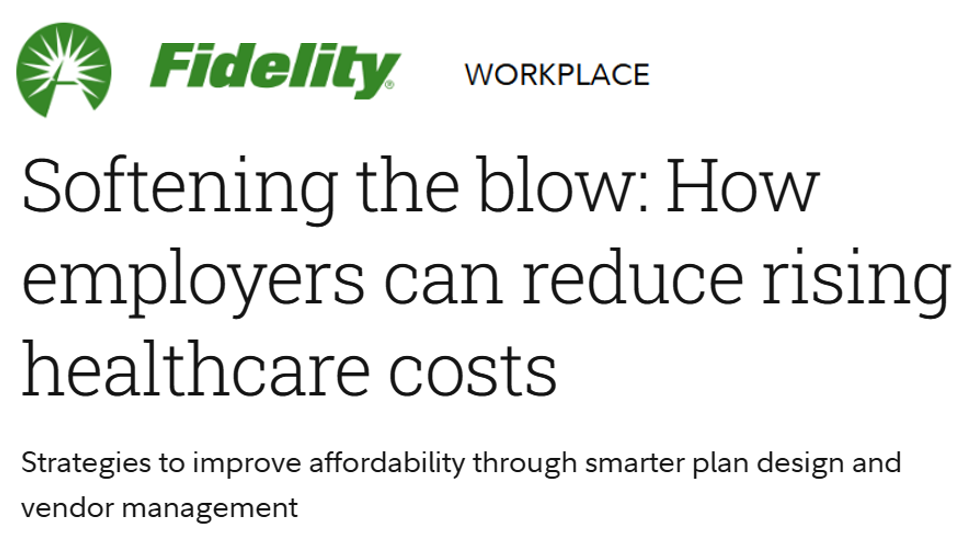 One of the best aspects of my work is collaborating across the health/care ecosystem to address how health citizens can deal with health care costs and and care for families. I'm grateful to have collaborated with Fidelity on their research into this issue,
  I'm gratified to be named on
 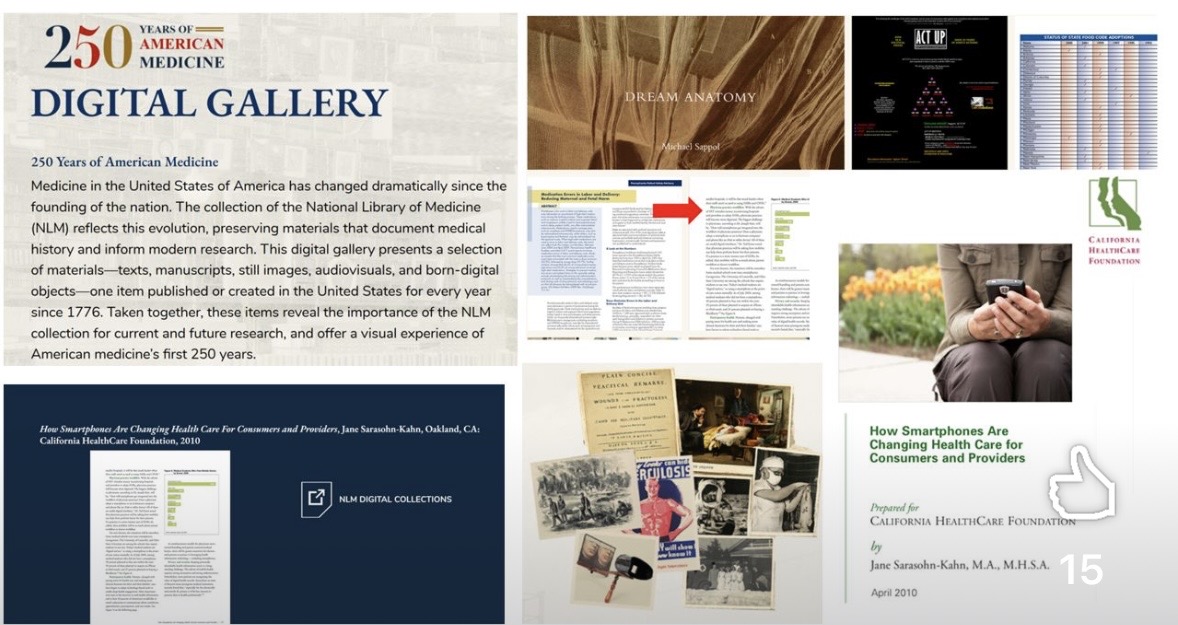 I’m celebrating America’s 250th birthday both patriotically and professionally, honored that the NLM included my 2010 paper, “How Smartphones Are Changing Healthcare for Consumers and Patients” as one of 250 items curated for the digital archive of 250 Years of American Medicine.