
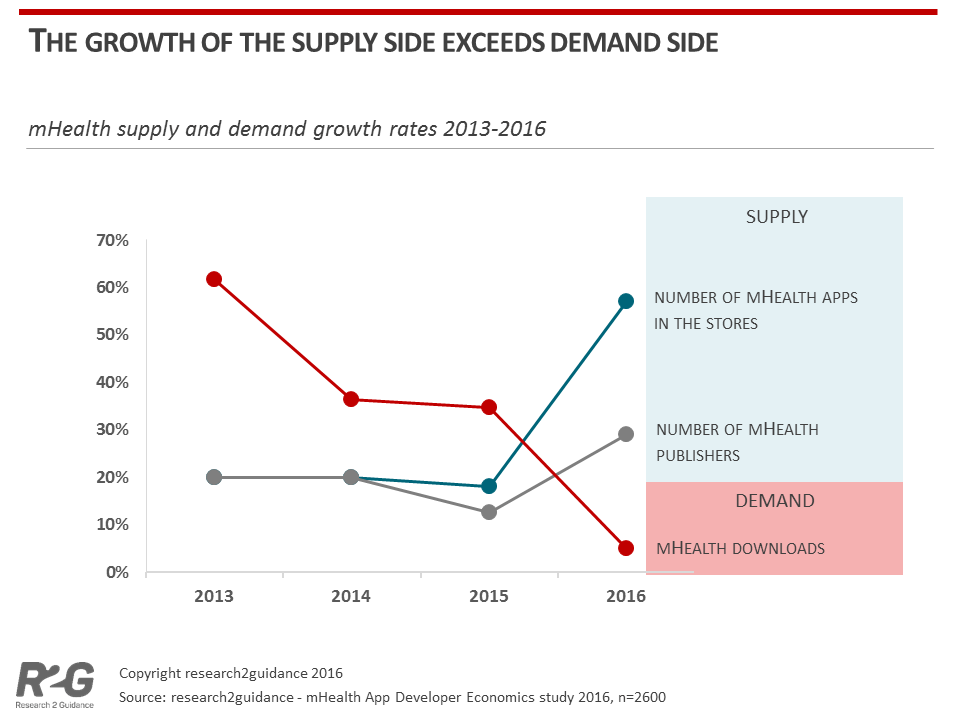
 Supply of mobile health apps greatly exceeds the demand for them, based on research2guidance’s report on the mHealth App Developer Economics 2016, analyzing the status and trends of the mobile health apps market. This is research2guidance’s sixth annual study on the topic.
The line chart illustrates the hockey stick growth rate of the number of mHealth apps in app stores in blue, reaching some 259,000 apps available in major app stores in 2016. The declining red line shows the growth rate of the demand for apps, falling to 7% in 2016 after growing 35% in 2015.
It’s not a money-making enterprise for the vast majority of mHealth app publishers, 60% of whom earned less than $1,000 per month from their app portfolios. The highest price threshold for which a consumer would be willing to pay out-of-pocket for an mHealth app is $10, research2guidance estimates.
It’s value-added services that could drive revenues for mHealth apps, the report notes, expecting a 15% annual growth rate that would generate a $31 bn business segment in 2020, the report forecasts.
 Going forward, reducing hospital readmissions and supporting adherence to treatment (e.g., prescription drug therapy management) would be the two main growth drivers for the mHealth apps market. Remote monitoring ranked highest as the app category with the greatest market potential in the next five years.
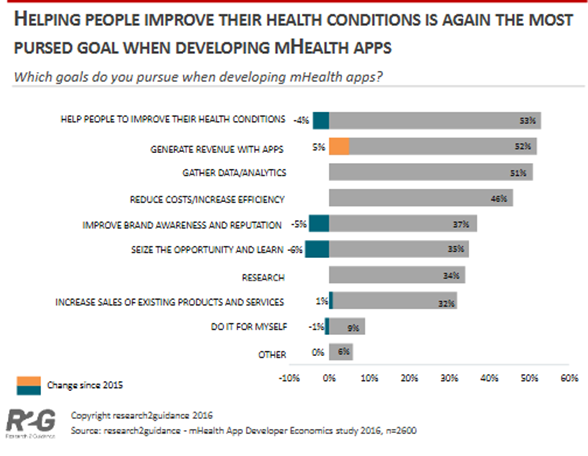
The second chart quantifies developers’ goals for health apps, under the strategic umbrella of helping consumers manage their health conditions. Generating revenue, gathering data for analytics, and reducing health care costs follow patient health management as goals for developing health apps.
Behavior change, the Holy Grail for mHealth apps, continues to be an elusive outcome for developers. Integrating a health care provider communication channel ranks high on developers’ intentions as a high-impact tactic — but is most difficult to implement, research2guidance recognizes.
What’s currently deployed for behavior change tactics is the use of personalized messages, dashboards, and educational content.
Ultimately, most mHealth apps are abandoned and only 10 to 20% of initial app downloads continue to be used at least once a month, the survey found.
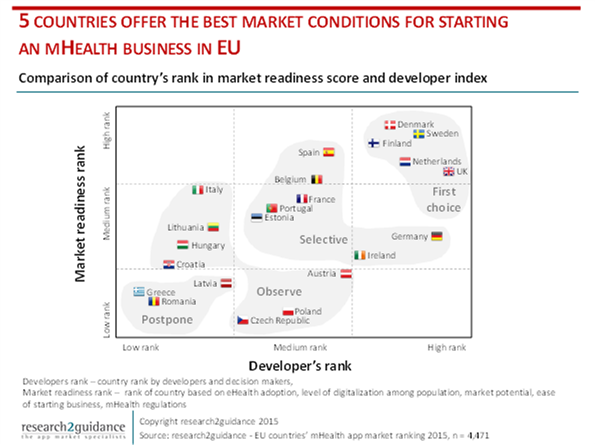 Health Populi’s Hot Points: As this study is the sixth annual look at mHealth apps by research2guidance, it can be valuable to take a look back at previous findings. As I mined these reports, one particular image stood out for me given my work across borders working in health systems beyond the U.S. Take a look at the third chart titled, “5 Countries Offer the Best Market Conditions for Starting an mHealth Business in EU.”
The upper right corner of the graph tells the story at the intersection of greatest market readiness and developers’ ranking: Denmark, Finland, the Netherlands, Sweden and the UK rank as the best bets for mHealth in the EU.
What these countries have in common is scale in terms of payor, and national commitment to a culture of health. They all boast a strong primary care backbone, which is a basis for high performing health systems found through many years of research by The Commonwealth Fund.
Greater investment in primary care and value for prevention in the U.S. could position a healthier American market for mHealth apps — coupled with enchanting, person-centered design. [A girl can dream, anyway.]
Research2guidance asserts that it’s health insurance companies that are the most important channel for mHealth apps. But I would argue that member churn/turnover can dissuade health plans from investing in mHealth-enabled programs, where a long-term commitment is crucial to success and behavior change. Health consumers in the U.S. may take mHealth “prescriptions” (recommendations, or information therapy Rx’s) more seriously from their health care providers, pharmacists, and nurses, where trust levels are higher than with the health insurance industry.
 Thank you
  Jane joined host Dr. Geeta "Dr. G" Nayyar and colleagues to brainstorm the value of vaccines for public and individual health in this challenging environment for health literacy, health politics, and health citizen grievance.