
 Prescription drug spending in the U.S. grew nearly 6% in 2016, reaching $450 billion, according to the QuintilesIMS Institute report, Medicines Use and Spending in the U.S., published today.
U.S. drug spending is forecasted to grow by 30% over the next 5 years to 2021, amounting to $610 billion.
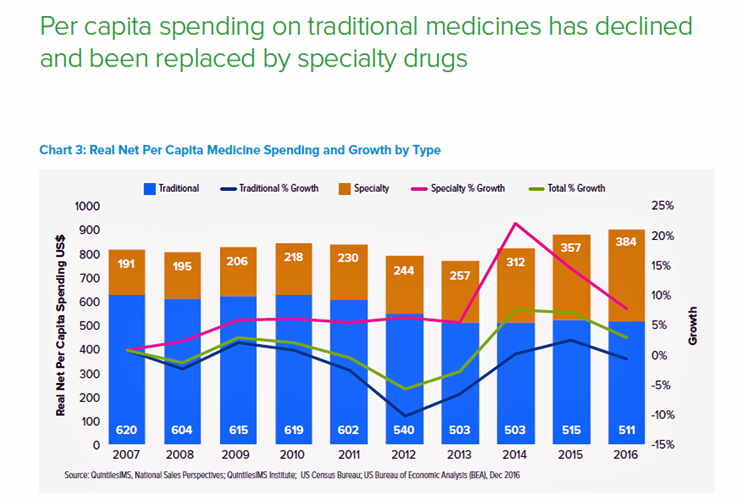
In 2016, per capita (per person) spending on medicines for U.S. health citizens averaged $895. Specialty drugs made up $384 of that total, equal to 43% of personal drug spending, shown in the first chart. Spending on specialty drugs continues to increase as a proportion of total drug spending: traditional medicines’ share declined in 2016, shown by the blue line in the graph.
QuintilesIMS defines specialty medicines as those treating chronic, complex or rare diseases, and tend to be high-cost, in excess of $6,000 per year. They often require administration by another individual, either a health care professional or a caregiver, and can be distributed through non-traditional channels (namely, specialty pharmacies).
Prescription volume grew by 3.3% in 2016, the highest growth rate since 2012, to 6.1 billion scripts written. Patients over 50 accounted for 70% of dispensed prescriptions and make up most of the volume growth. The average number of prescriptions for someone over 65 in the U.S. is 4 concurrent medicines.
The largest growth rates for prescription volumes were for hypertension and mental health, followed by anti-diabetics, lipid regulators, and anti-ulcerants. Notably, prescriptions for pain medications fell in 2016 by 5.4%.
QuintilesIMS details patient-out-of-pocket costs, which is a tale of several payment streams. First, consider the growth of zero co-pays for medicines. Prescriptions dispensed at zero patient out-of-pocket costs high 30% in 2016; that is, one-third of total prescriptions were essentially “free” at the point of prescription payment. This was true for Medicaid patients (some of whom have a $10 co-pay), some commercially insured patients in plans with zero dollar co-pay for generics, and patients covered under the Affordable Care Act (ACA) for preventive treatments and contraceptives.
Second, the growth of coupons and manufacturer out-of-pocket discounts are more available to patients as their cost exposure has increased under high-deductible health plans and among people who remain uninsured or are under-insured. Drug companies have grown patient assistance programs, coupons and vouchers. Companies have figured out that in the first quarter of the health insurance plan’s calendar year is when some patients need discounts most, as patients are at risk of not filling a prescription when faced with paying full cost out-of-pocket to meet their deductible amounts. In 2016, 1 in 5 patients used a copay assistance coupon to fill a prescription.
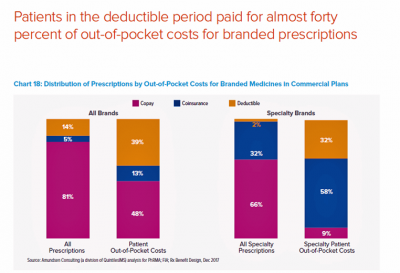
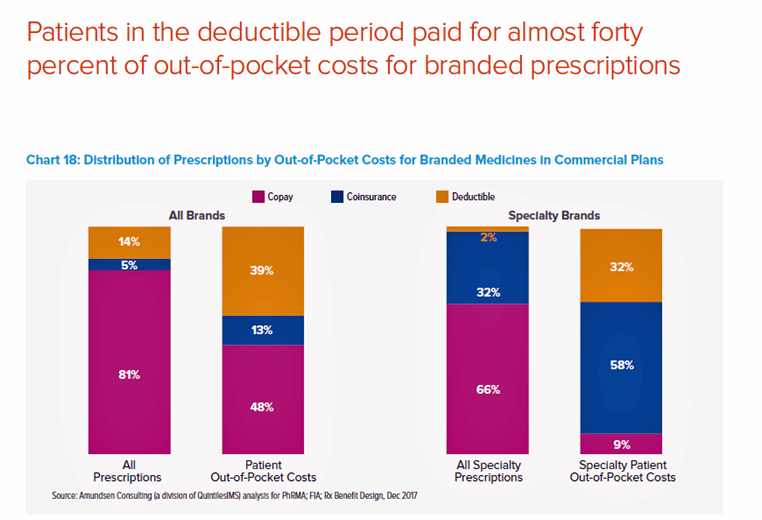
A third part of the health consumer Rx payment story is about high-deductible health plans and personal drug spending. A key health consumer finding in this report is that patients in the deductible period paid for nearly 40% of out-of-pocket costs for branded prescriptions. Specialty prescriptions account for 91% of out-of-pocket spending by patients. Patients with specialty prescriptions in the deductible accounted for 2% of prescriptions but 32% of out-of-pocket costs, shown in the second chart. About 1 in 4 prescriptions are abandoned by patients during the deductible phase. “When a patient’s costs are in a deductible, prior to shifting to coinsurance or reaching an out-of-pocket maximum, they are 2.5 times more likely to abandon brand prescriptions (23% versus 9%),” the report notes.
An important note on methodology: QuintilesIMS accounts for U.S. drug spending based on actual spending net of discounts and rebates. This is a special artifact of American healthcare, where patient assistance programs and coupons are available to assist some patients to pay lower costs for medicines based on income and medical necessity. The other offset from listed price to net price is rebates negotiated by payers as discounts.
 Health Populi’s Hot Points: As I was finalizing this post this morning, listening to Morning Joe on MSNBC, I overheard two ads for services that help people find lower prices for prescription drugs: Blink Health and GoodRx. These ads were both broadcast between 6 and 630 am.
Note that 3 in 4 visits to primary care providers results in at least one prescription being written, the CDC tells us. So drug costs impact the mainstream of people, and the issue of high drug costs has hit middle America hard. Remember the EpiPen pricing shock of 2016?
“There is an out-of-control epidemic in the United States that costs more and affects more people than any disease Americans currently worry about. It’s called nonadherence to prescribed medications, and it is — potentially, at least — 100 percent preventable by the very individuals it afflicts,” and costs nearly $300 bn a year in the U.S. This is the introduction to a column by Jane Brody called, The Cost of Not Taking Your Medicine, published in the New York Times on April 17, 2017.
Cost is a big deterrent which causes some people to self-ration medicines: whether not fill a prescription from the start, or cutting back later after starting a course of medication treatment – called “abandonment” in the field. “When the co-pay for a drug hits $50 or more, adherence really drops,” Dr. Bender was quoted in the Brody column.
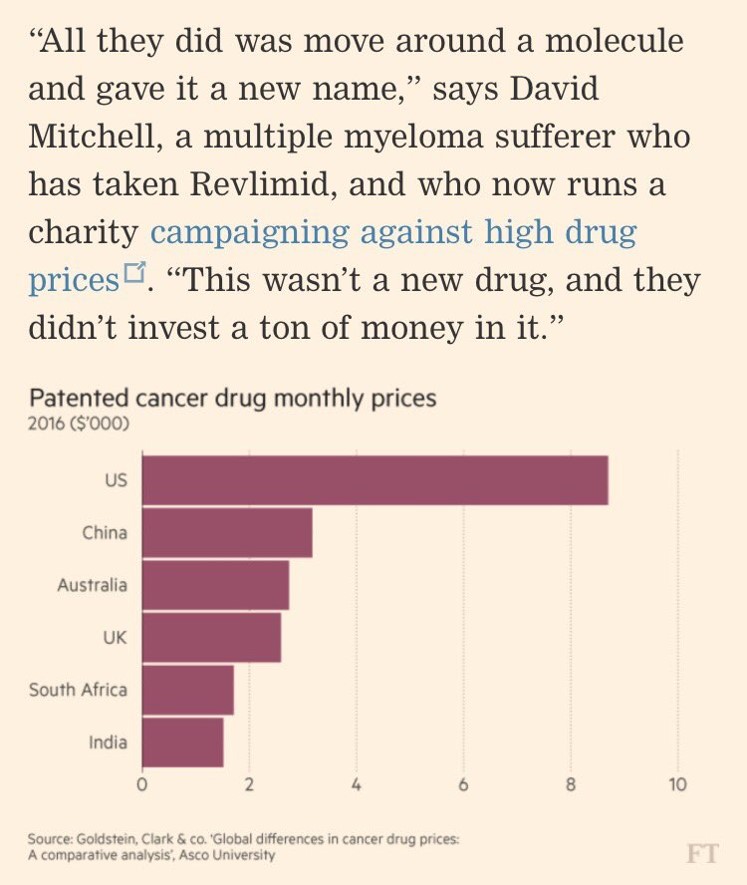
The Financial Times of London published a full-page, meticulously researched piece on the cost of drugs, and in particular, those for cancer. This chart appeared in that article, graphically illustrating the fact that per month, U.S. patients face much higher costs for treatment than health citizens in other nations – Australia, China, India, South Africa, and the UK in this study. Americans face costs for cancer drugs about four times greater than those faced by Australians and Britons in this analysis.
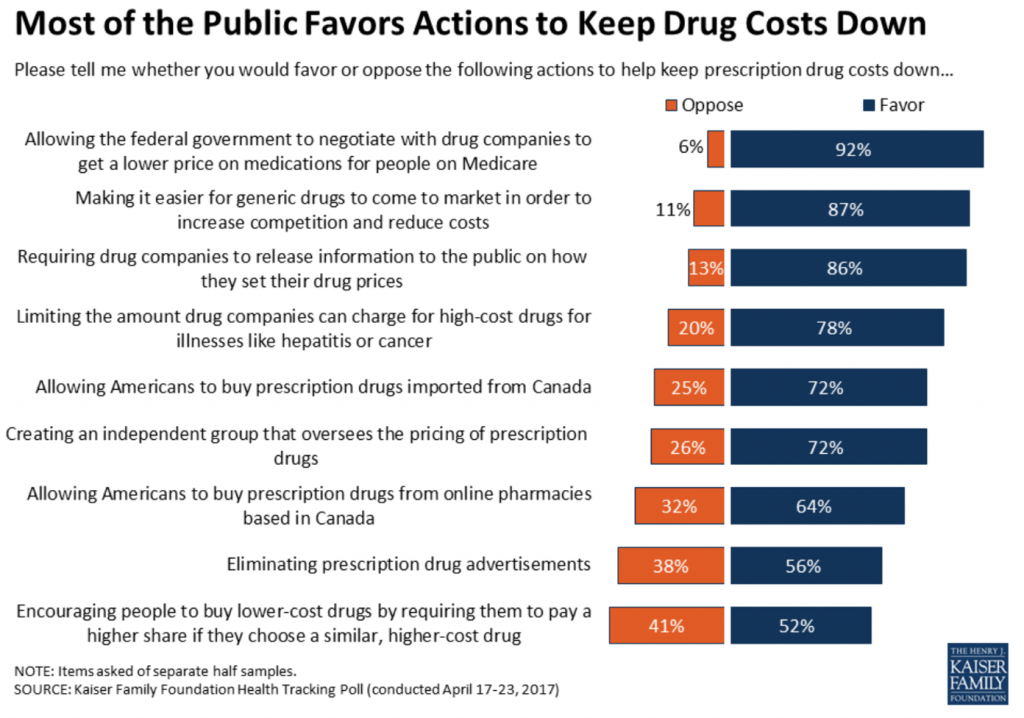 The cost of medicines may be the one issue in U.S. health care that unites citizens across the political spectrum — Democrats, Independents and Republicans alike. Look at the chart from the Kaiser Family Foundation for evidence of the unification behind drug price controls, from the KFF Health Tracking Poll conducted in January 2017. 9 in 10 Americans favor allowing the Federal government to negotiate with drug companies for lower prices for Medicare enrollees. 8 in 10 people would like to require drug companies to be more transparent in explaining to the public how drug prices are set. 8 in 10 people would like to limit the amount drug companies can charge for high-cost drugs for illnesses like cancer.
There’s a new sort of counter-detailing campaign about drug costs from the Campaign for Sustainable Drug Pricing. Here’s the video launched this week.
 Thank you
  Jane joined host Dr. Geeta "Dr. G" Nayyar and colleagues to brainstorm the value of vaccines for public and individual health in this challenging environment for health literacy, health politics, and health citizen grievance.