
“Spend more. Get less.” If a retailer advertised using these four words, how many consumers would buy that product or service?
This is the American reality of healthcare spending in 2016, told in the OECD report, Health at a Glance 2017.
I present five charts from the study in this post, which together take the current snapshot health-economic lesson for the U.S.
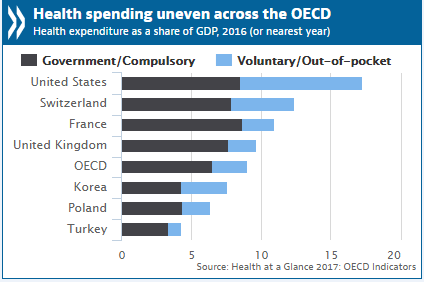
First, look at health expenditures as a share of gross domestic product: the U.S. is number one above Switzerland, France, and the UK, and about two times the OECD average. Note, too, the proportion of out-of-pocket and so-called “voluntary” spending versus what other countries’ health citizens pay. In the U.S. it’s more than one-half of spending. That voluntary aspect is the non-governmental, non-mandated portion: namely, employer-based healthcare spending and consumers’ out-of-pocket contributions to their own healthcare for self and family.
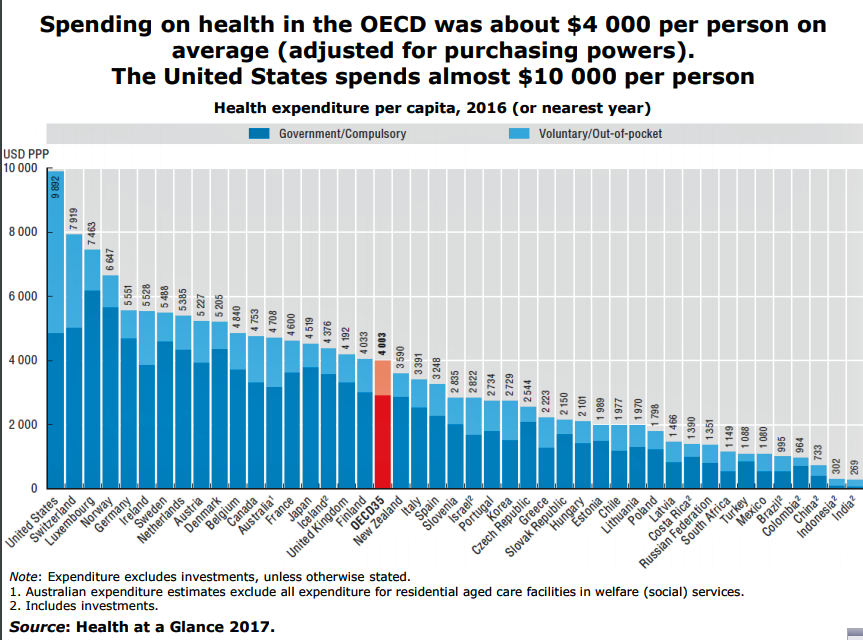
Where does the U.S. fall in per capita healthcare spending compared with other developed countries? America is number one again, spending about 2.5 times more than the average OECD country: that’s nearly $10,000 per person versus $4,000 in other countries.
Switzerland once again comes in at second place, spending nearly $2,000 less than the U.S., and Luxembourg, spending over $2,400 less than the U.S. Italy and Spain, both with a national health service, spend around $3,300 per capita.
What is the return-on-investment for the super-sized healthcare spending in the U.S.? Based on life expectancy at birth, it’s an epic fail.
If the U.S. healthcare system were a company, no rational investor would put a buck into it based on these statistics.
The third chart shows that the 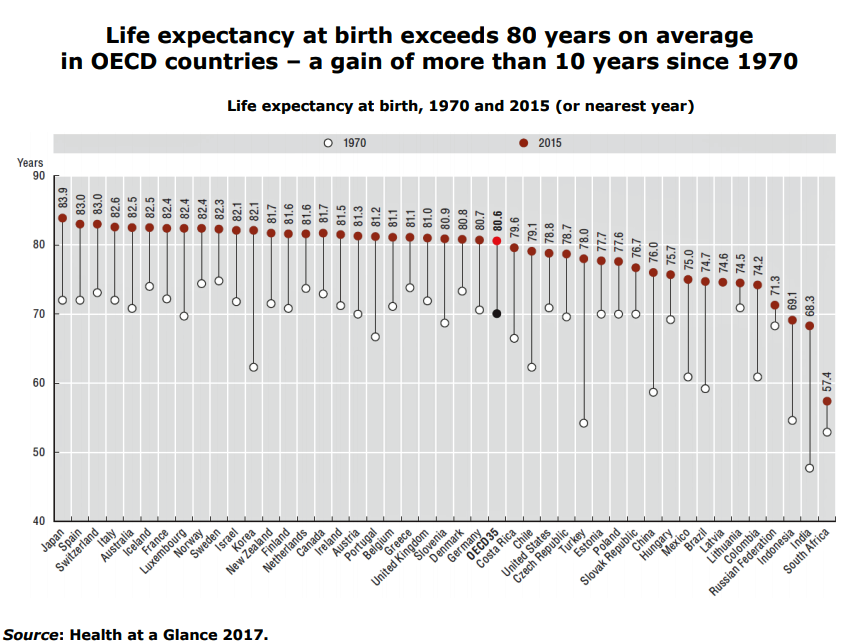 U.S. ranks below the OECD average, behind Costa Rica and Chile. Top life expectancies are found in Japan, Spain, Switzerland, Italy, France, Luxembourg, Norway, Sweden, Israel, Korea, New Zealand, Finland, the Netherlands, Canada, Ireland, Austria, Portugal, Belgium, Greece, the U.K., Slovenia, Denmark and Germany.
In line with this U.S. are the Czech Republic, Turkey, Estonia, and Poland.
Look back at the previous chart, which shows that the Czech Republic spends $2,544 per capita on healthcare; Turkey, $1,088; Estonia, $1,989; and, Poland, $1,798.
Next, consider obesity in OECD nations. Obesity has been rising in many countries in the community, with about 25% of children overweight across all OECD countries. The U.S. ranks second to last, just before Chile, among OECD peers, with nearly 4 in 10 kids overweight or obese.
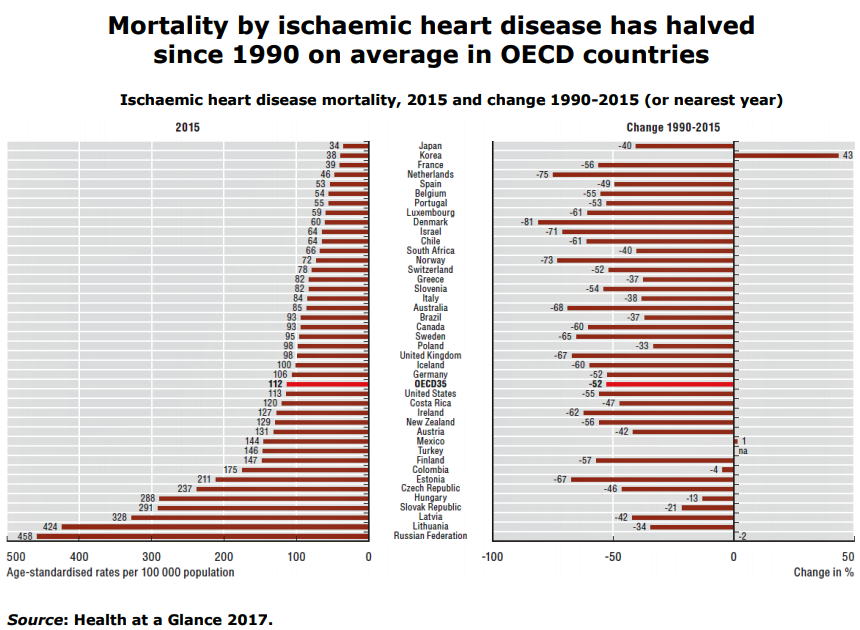
It is not a shock, then, to check out chart number four here, ranking mortality via heart disease. The good news is that deaths due to heart disease have dropped across the OECD, but for the U.S., the decline was significantly lower compared with fellow nations — and below OECD average.
Health Populi’s Hot Points: The last chart summarizes some of the key OECD findings in one picture, with the vertical red lines indicating negative performance relative to the OECD averages for:
- Life expectancy, for both men and women
- Obesity
- Population coverage for healthcare
- Consultations skipped due to cost (that is, in Health Populi parlance, consumer self-rationing of care due to cost), and,
- Asthma and COPD admissions, among other negative findings not included in this summary graphic.
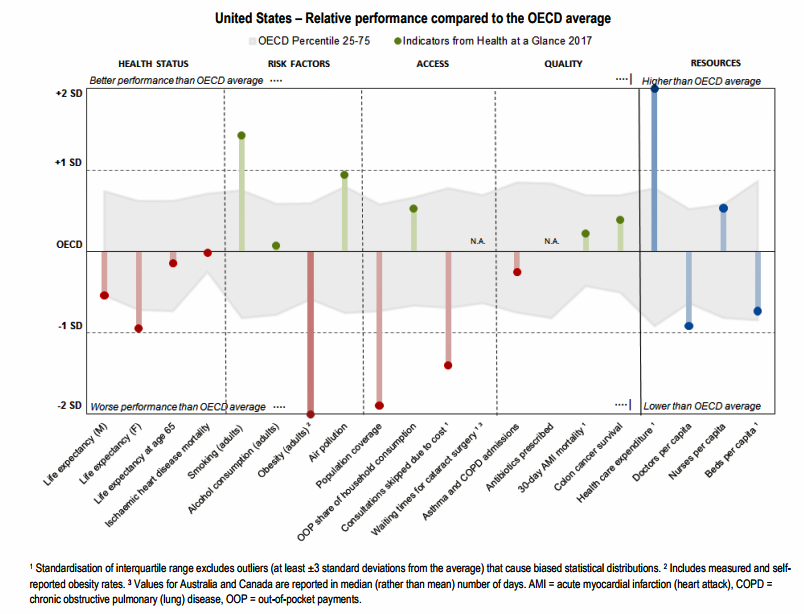
The U.S. life expectancy has worsened since the last OECD study when U.S. was one year above the OECD average. Now, it is nearly two years below the OECD average.
On the risk factor front, there are two important successes to point to: smoking, which is quite low compared with the OECD average, and air pollution.
In America, both of these factors improved over time through a national focus on public health promotion and smoking cessation efforts, and environmental regulations supporting air quality. Sustaining these efforts will be important if U.S. health citizens and healthcare spending are to benefit from managing these social determinants of health – smoking and air quality — which directly relate to heart disease, respiratory disease, and cancer, and the costs to treat (versus prevent) them.
The fact that the U.S. ranks high on people self-rationing care due to cost speaks to healthcare access barriers, as well as risk factors that impact people in daily life beyond health system access. Implementing the Affordable Care Act began to positively impact those access barriers, though not so much the “affordability” issue promised by the legislation’s name. Further work must be done to address both access and cost barriers.
The fact that sign-ups for Obamacare plans over the past few weeks have been brisk and in high-demand illustrate that Americans value health insurance benefits even in the midst of various efforts to stifle the supply and demand sides of the health insurance market.
This glance at the OECD data shows a picture of a financially unsustainable health system at a fork-in-the-road moment: will American health citizens who lack the means to pay out-of-pocket be able to access healthcare services in 2018? Will the Federal government support health baked into public policies that boost health and lower healthcare spending through cleaner air (namely, through the Environmental Protection Agency), public health programs for healthy food and smoking cessation, and social supports for people at-risk of opioid and other substance dependence (which tie to job and economic security, social isolation, violence and adverse childhood events)? These dots all directly connect to health and healthcare spending.
 One of the best aspects of my work is collaborating across the health/care ecosystem to address how health citizens can deal with health care costs and and care for families. I'm grateful to have collaborated with Fidelity on their research into this issue,
  I'm gratified to be named on
 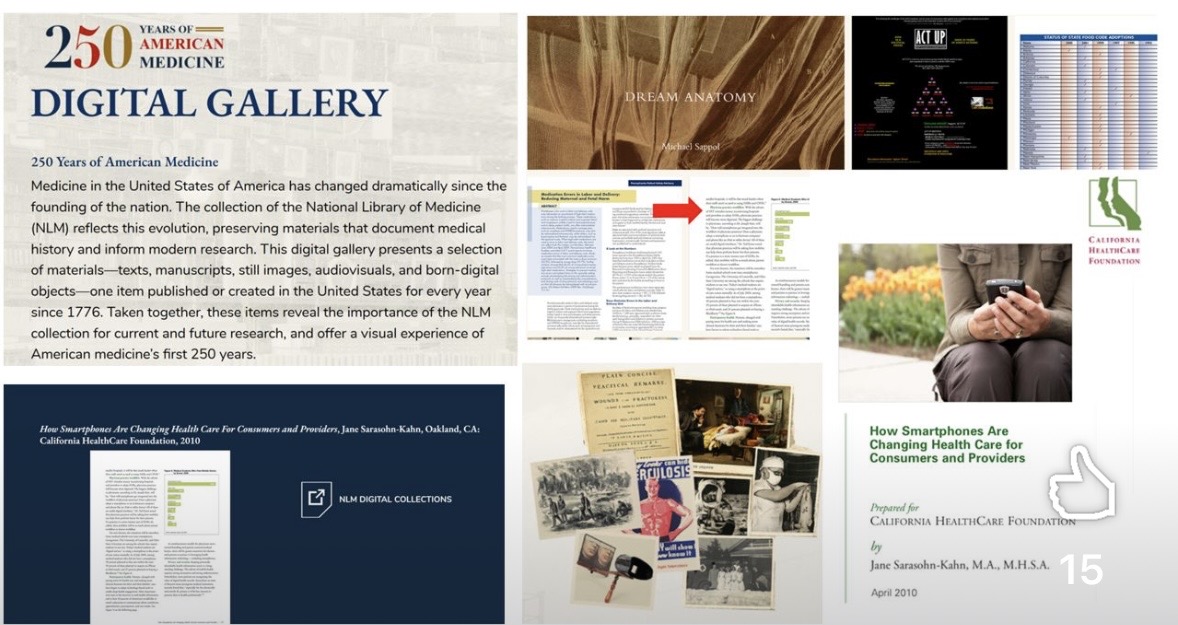 I’m celebrating America’s 250th birthday both patriotically and professionally, honored that the NLM included my 2010 paper, “How Smartphones Are Changing Healthcare for Consumers and Patients” as one of 250 items curated for the digital archive of 250 Years of American Medicine.