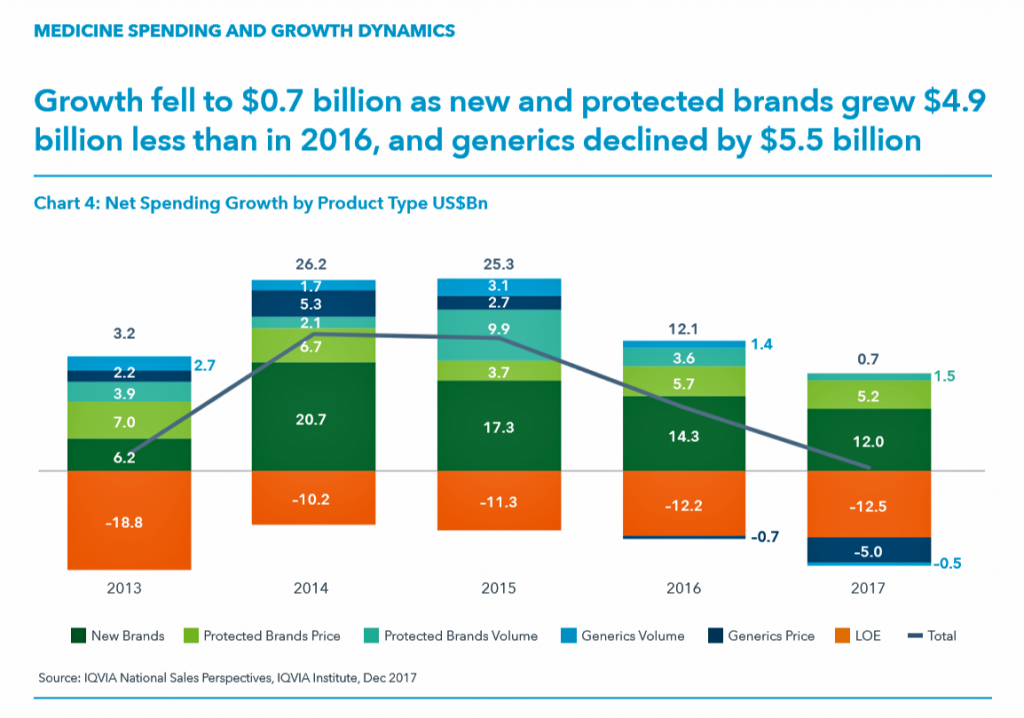
While the use of medicines continues to rise in the U.S., spending grew by only 0.6% in 2017 after accounting for discounts and rebates. In retail and mail-order channels, net spending fell by 2.1%.
Prescription drug spending on branded products grew nearly $5 billion less than in 2016; generic drug spending fell by $5.5 billion, according to Medicine Use and Spending in the U.S., a report from the IQVIA Institute for Health Data Science. The report reviews medicines spending in 2017 looking forward to 2022.
There were over 5.8 billion prescriptions dispensed in 2017, and generic drugs accounted 90% of them. 97 percent of the time, generic drugs were dispensed when possible. Consider that 97%: this means that nearly all the time a drug was dispensed, it was a generic product.
The first chart illustrates the downward price pressure that generics exerted on prescription drug spending in 2017 compared with spending growth among new brands. That’s the navy blue component in each bar, indicating the $5 bn drop in 2017). See the orange component: that’s “LOE,” or “loss of exclusivity,” which is the value of a branded drug on-patent that lost sales due to a generic equivalent entering the market. These are the forces countering the branded side of medicines for new products and existing brands on-patent. “Growth slowed in 2016 and declined by $5.5 billion in 2017 as greater competition in a number of markets drove down prices,” IQVIA explains.

Let’s not get too comfortable assuming overall growth will continue to fall. IQVIA recognizes that medicine spending is shifting “strongly” to specialty medicines away from traditional treatments.
It’s those specialty treatments that are the fast-growing portion of spending, driving some consumers’ out-of-pocket (OOP) costs up. In 2017, patients spent $57.8 billion OOP for prescription drugs: OOP costs include copayments, coinsurance, payments during the deductible phases of health insurance, or retail payments for drugs due to the lack of prescription drug insurance coverage. The second chart illustrates OOP spending for the 5.5 billion prescriptions filled in 2017:
- 3.4 million prescriptions cost patients over $500, adding up to $5.2 billion in OOP costs. That’s equal to an average of $1,502 per prescription, accounting for 0.1% of all filled prescriptions.
- 10.7 million prescriptions cost patients between $250 to $500, totaling $3.9 billion, on average $362 per prescription.
- 80% of prescriptions cost under $10, representing 22% of OOP costs.
Against the low-cost generic backdrop, we can expect the special drug portion of the medicines bill to gain greater share of spending to 2022. Spending on new brands for specialty medicines drove $9.8 billion of the $12.0 bn net growth in 2017. There were 42 new active substances launched in 2017, 32 of which were specialty therapies. These were in the areas of oncology, HIV, MS, and narrower therapies for Huntington’s disease, atopic dermatitis, and spinal muscular atrophy, among other conditions.
IQVIA Institute is the renamed IMS Institute.
 Health Populi’s Hot Points: As new-new drug therapies come on-stream, prescribers look to trusted information sources beyond the pharma manufacturer of the product for information on use of the new medicine. SERMO, the physician social network, launched its Drug Ratings program in May 2017. Some 800,000 physicians belong to SERMO, where peers discuss a range of topics including but not limited to diseases and conditions, medical and information technology, and with the Drug Ratings program, prescription drugs.
As of March 2018, there were over 3 million data points on over 600,000 drug ratings in the SERMO database, which the company terms “the FICO score for drugs.” These ratings cover over 2,100 pharmaceutical brands for which over 40,000 having submitted opinions.
SERMO’s poll of 2,900 physician members learned that:
- 83% of doctors say the opinion or feedback of a peer doctor has changed their perception of a drug
- 80% trust recommendations of doctors with real world experience with a drug, and
- 84% believe Drug Ratings will lead to better patient outcomes.
As value-based payment continues to grow among physicians and other prescribers, and among patients taking on high-deductibles and coinsurance for higher-cost specialty drugs, understanding details about prescription drug use from peers (both physician-to-physician and patient-to-patient) will become increasingly important. More patients are asking physicians for specifics at the point-of-prescribing about their own patient cost-shares for a specific prescription drug, as well as information on side-effects, toxicity, and other known real-world experiences gathered by doctors and patients. The SERMO Drug Ratings community is one signpost in this increasingly bipolar world of prescription drug prescribing and pricing.
 Where SERMO is querying physicians’ views on prescription drug experiences, 23andme, the direct-to-consumer genetics company, is going DTC for patients’ views on meds. Announced last week, 23andme is leveraging the wisdom-of-patients to crowdsource treatment opinions on eighteen medical conditions, such as ADHD, asthma, depression, and migraine, among others. This information will be gathered on the websites Conditions pages, an example of which is shown here.
Note that treatments go beyond pills, including exercise, yoga, meditation, and pets in this example.
This is designed in concert with a patient-person’s life flows: when pharma thinks “value beyond the pill,” they may not be considering lifestyle behaviors under the patient’s control. When a patient thinks value, she includes these kinds of approaches, along with food-as-medicine and financial health. Now we’re talking FICO and health….


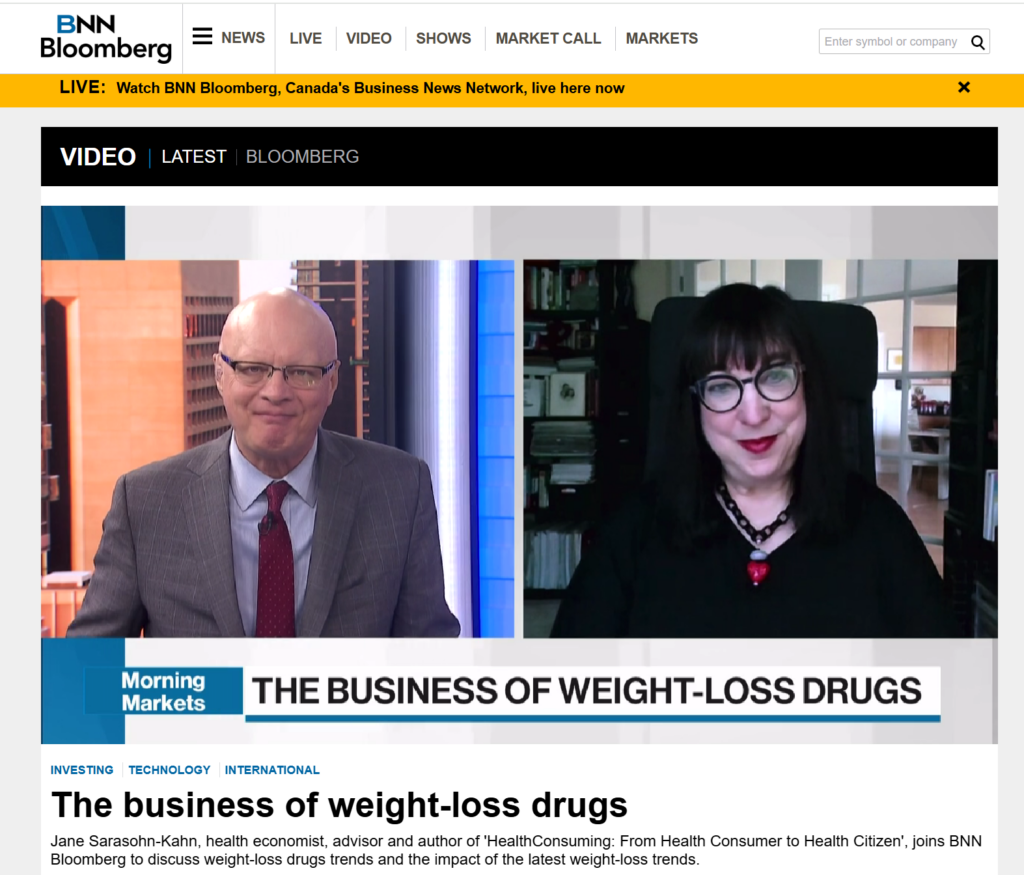 Interviewed live on BNN Bloomberg (Canada) on the market for GLP-1 drugs for weight loss and their impact on both the health care system and consumer goods and services -- notably, food, nutrition, retail health, gyms, and other sectors.
 Thank you, Feedspot, for
  As you may know, I have been splitting work- and living-time between the U.S. and the E.U., most recently living in and working from Brussels. In the month of September 2024, I'll be splitting time between London and other parts of the U.K., and Italy where I'll be working with clients on consumer health, self-care and home care focused on food-as-medicine, digital health, business and scenario planning for the future...