
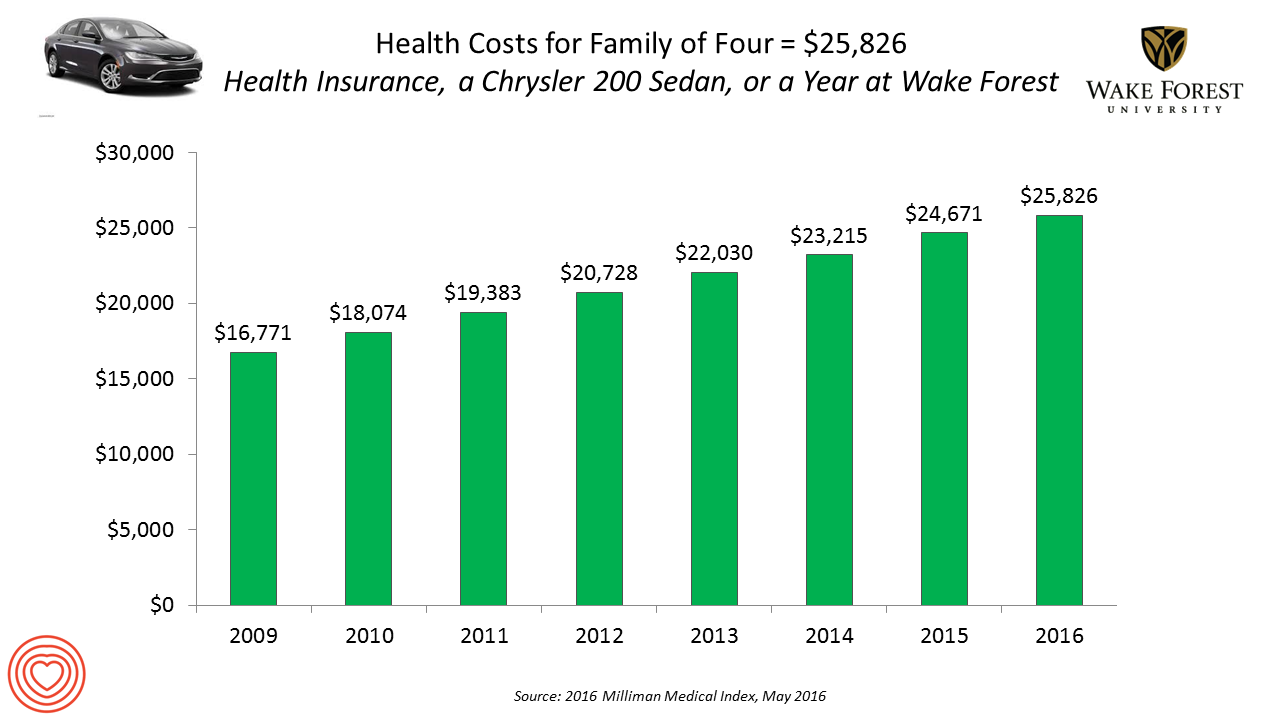
 If you had exactly $25,826 in your pocket today, would you rather buy a new Chrysler 200 sedan, send a son or daughter to a year of college at Wake Forest University, or pay for your family’s health care in an employer-sponsored preferred provider organization?
Welcome to the annual 2016 Milliman Medical Index (MMI), one of the most important health economic studies I’ve relied on for many years. This year’s underlying question is, “Who cooked up this expensive recipe?” posed in the report’s title.
The key statistics in this year’s MMI are that:
- Healthcare costs for a typical family of four grew by 4.7%, the lowest annual increase since the launch of the MMI in 2001. However, that percent growth rate is more than twice the average 2% annual increase in median household income between 2004 and 2014.
- The proportion of the employee worker’s total costs increased by 5.3% in 2015 and the employer’s cost by 4.2% In 2016, workers’ portion of cost sharing of the $25,826 is 43%.
- The fastest-growing component in the MMI is prescription drugs, now comprising 17% of total healthcare spending, equal to $4,270. Prescription drug expenses rose 9.1% between 2015 and 2016. Specialty drugs now equate to 35% of all Rx costs, and 6% of total healthcare spending in the U.S.
Employers are adopting a variety of tactics to slow healthcare inflation, Milliman notes. These include:
- Expanding health care consumerism, using value-based insurance and defined contribution in health plan designs
- Integrating the delivery of care through narrowing provider networks and reforming provider payment (via accountable care organizations, patient-centered medical homes, bundling payments, etc.)
- Using technology, such as telemedicine, electronic health records, and big data/analytics.
Milliman identified five components of health care services in the MMI: inpatient, outpatient, professional services, pharmacy, and other services. Facility care comprised 50% of total spending, with 31% allocated to inpatient and 19% for outpatient care. Professional spending (on physicians, physician assistants, nurse practitioners, chiropractors and other licensed caregivers) receive another 30% of heathcare spending. Prescription drugs via pharmacy comprises 17% of spending. Four percent of spending goes to “other” services such as durable medical equipment, home health and ambulance, among other line items.
Here are links to my posts covering the MM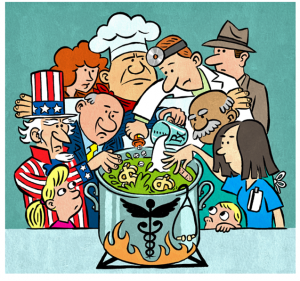 I for the past three years:
2015 – Health Care Costs for a Family of Four In the U.S. Reach $24,671 in 2015
2013 – Health Care Costs For A Family of 4 in 2013: A College Education, a Diamond Or a 4-Door Sedan
Health Populi’s Hot Points: So then, responding to Milliman’s question, “Who cooked up this expensive recipe?” Based on the report’s cover, shown here, it’s all the players in the healthcare ecosystem. Pictured are the doctor, the hospital administrator, a pharma sales rep, a nurse, Uncle Sam, and patients, young and older.
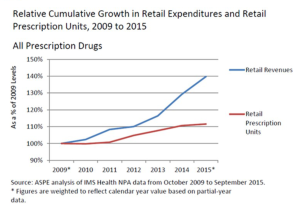 The fastest-growing component in health care cited in the MMI research is prescription drugs, now accounting for 17% of health care costs, the expense growing much faster than both the annual Consumer Price Index and workers’ wages. The force driving the Rx line item up so dramatically is specialty drug costs, frequently discussed here in Health Populi and recently in this post on the topic.
Many consumers continue to self-ration prescription drugs due to costs, for which the “consumerism” program of value-based insurance can play a key role in nudging people to fill prescriptions and take medications in the right (prescribed) dose at the right time. These programs artfully assign a lower (or no) copay for drugs treating chronic conditions, and are increasingly coupled with digital enhancements like apps, text messages, or calls via interactive voice response and patient engagement providers. Fashioning and prescribing “digitally enhanced therapeutics” is meant to bolster adherence, lower medical errors and improve outcomes.
But the pharma “cook” isn’t the only contributor to growing health care costs. As for the one-half of spending that goes to facilities, inpatient and outpatient, the promise of telemedicine and telehealth through both value-based incentives (with lower prices for virtual care, when appropriate) and narrowing networks of providers, can help mitigate institutions’ role in rising health care costs. Health care providers that increasingly live in the value-based reimbursement world — taking on bundled payment for joint surgery, accountable care, and pay-for-performance contracts — will need to broaden their provider sites beyond Pill Hill and higher-cost outpatient centers where consumers (especially when paying first-dollar in high-deductible health plans) would rather visit care sites in the community closer to where they live, work and play.
43% of $25,826 is real money to families in American earning, on a median basis, was $53,657 in 2014, the latest stat available from the U.S. Bureau of the Census. Do the math: the $11,105 for which the employee is responsible in the company’s PPO plan equates to 21% of gross earnings. That’s $1 in every $5 of household spending. Will that be seen as “value” in the eye of consumers? One thing of which I’m certain: the patient feels like the new payor.
Note on tuition at Wake Forest University 2015-16: the $25,826 is quoted as the “average net cost” for tuition, including grants and scholarships awarded to a typical student. The “full retail” at Wake Forest U. will reach $48,746 for the 2016-17 school year. Would that health care subsidies were as rich for the average U.S. health citizen!
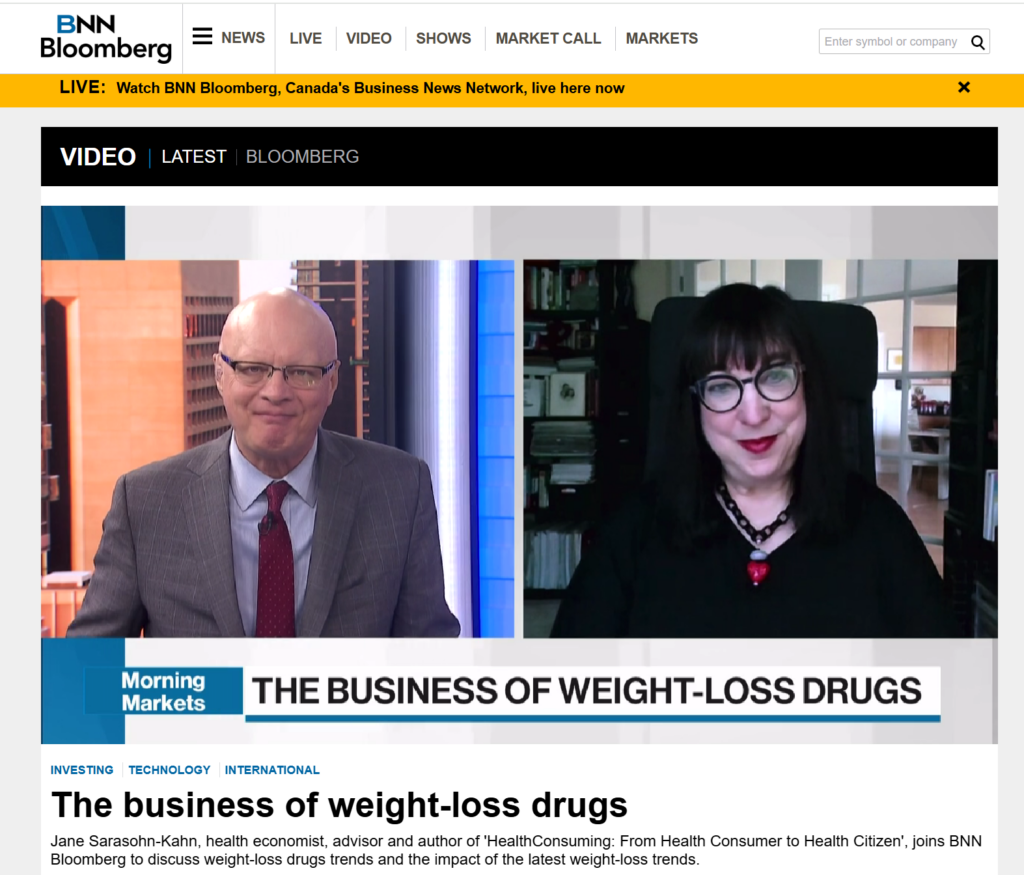 Interviewed live on BNN Bloomberg (Canada) on the market for GLP-1 drugs for weight loss and their impact on both the health care system and consumer goods and services -- notably, food, nutrition, retail health, gyms, and other sectors.
 Thank you, Feedspot, for
  As you may know, I have been splitting work- and living-time between the U.S. and the E.U., most recently living in and working from Brussels. In the month of September 2024, I'll be splitting time between London and other parts of the U.K., and Italy where I'll be working with clients on consumer health, self-care and home care focused on food-as-medicine, digital health, business and scenario planning for the future...