
 Disparities in Americans’ health vary among people living in each of the 50 states. These differences in health status generally fall into two regions: north and south, found in the Commonwealth Fund’s 2018 Scorecard on State Health System Performance.
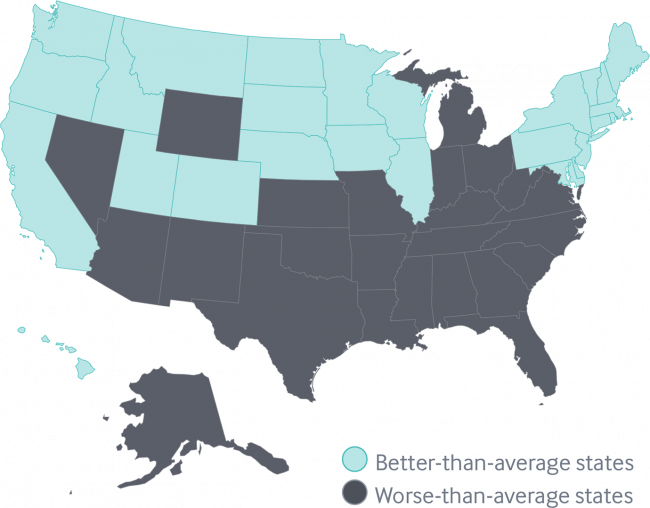
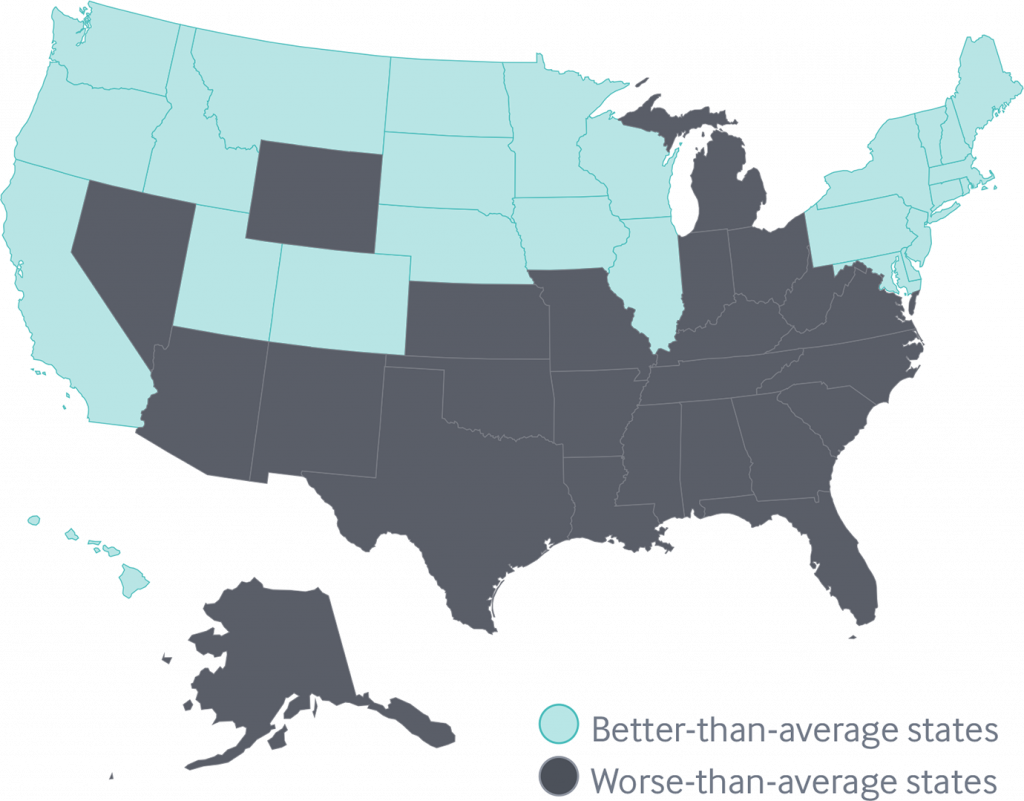
The map shows this stark geography-is-health-destiny reality: the worse-than-average states, the Fund found, run from Nevada southeast to Arizona, through New Mexico and Texas all the way to Atlantic Ocean and the Carolinas, then north west all the way up through the industrial Midwest states through Michigan to the north. Wyoming is the only non-contiguous state in the worse-performing U.S. state map.
Health citizens living in states in New England, and then those west of Michigan and north of Missouri and Kansas, demonstrate better-than-average health outcomes.
The top-line of this national health scorecard is that “deaths of despair” are surging, due to suicide, alcohol, opioids, and other drugs whose use has grown by 50% since 2005 to 2016. Premature deaths are rising, reversing ten years of improvement throughout America.
The social determinants of health — income and good jobs, using tobacco, and having health insurance — bolster good health.
Ultimately, the Fund asserts, where you live matters. If you’re in Hawaii, Massachusetts, Minnesota, Vermont and Utah, you will probably be healthier than if you live in the lowest-ranked states of West Virginia, Florida, Louisiana, Oklahoma, and Mississippi.
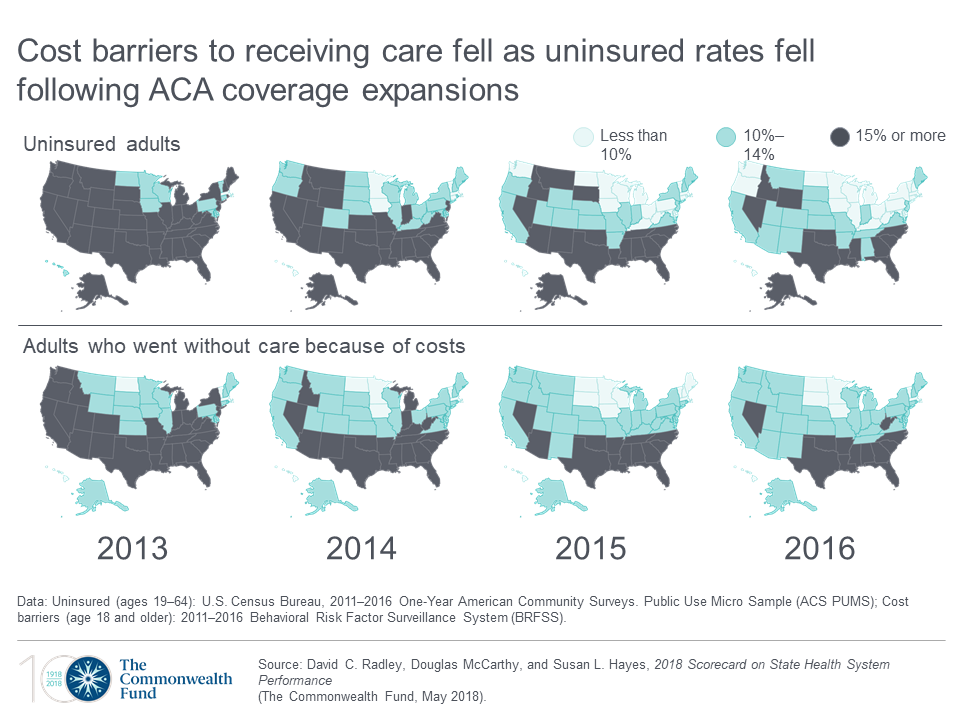 Health Populi’s Hot Points: The second graphic includes two sets of eight maps of the United States, one showing trends of uninsured Americans by state, and the lower group proportion of people who avoided healthcare due to costs. Light blue to blue is a good thing; the grey area is negative for level of uninsured population and greater self-rationing health care services due to costs.
The top row illustrates that the ACA covered a lot of people with health insurances between 2012 and 2016. The lower row shows that the level of self-rationing due to costs fell across the entire northern section of America, leaving at least 15% of people living in the deeper south to continue to ration in 2016 as they did in 2012.
“Insurance coverage is a necessary but not sufficient condition” to improve health outcomes in America, the Fund asserts in its report summary. Integrating social care, addressing social determinants, and expanding quality and accessible mental health services to reach people who need them will help to bring more “blue” to the map of the United States.
To get to more blue, there are several performance indicators that must improve that would yield quantifiable benefits to the nation’s public health and individuals’ personal health. If all states achieved the top rates of performance…
- 14 million fewer adults would skip care due to cost
- 837,000 more young children would receive all recommended vaccines
- 1 million fewer Medicare enrollees would receive a high-risk prescription drug
- 5.7 fewer emergency room visits for non-emergency care could be treated with primary care
- 89,000 fewer people would die before 75 years of age from treatable diseases.
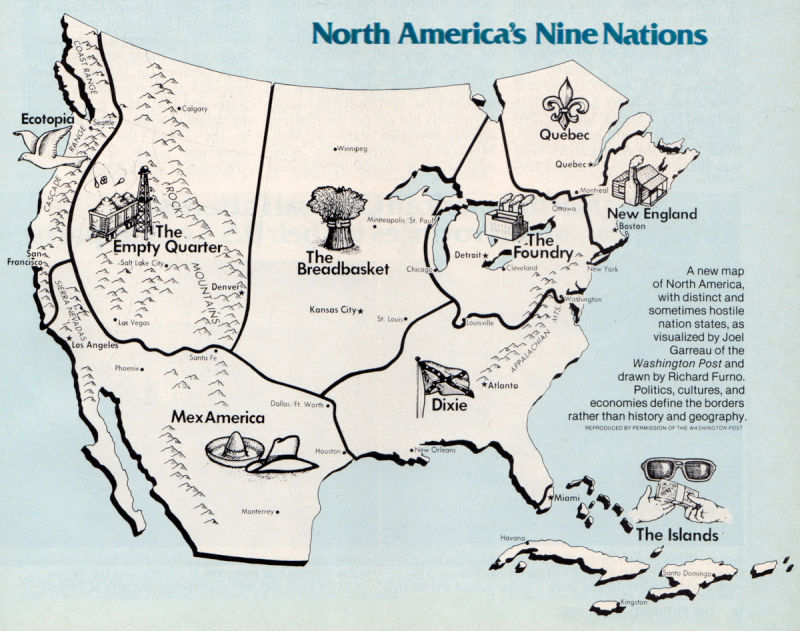 In 1981, I read the book The Nine Nations of North America by Joel Garreau. The author mapped a new concept for America and part of Canada thirteen years before NAFTA was agreed. The map, shown here, grouped states into nine distinctive cultural and economic regions: New England (or New Britain), covering both the quintessential states along with eastern Canada; The Foundry, the industrial heartland of North America, including the Great Lakes region and the manufacturing northeastern states; Dixie, generally the secessionist Confederate states of America but excluding western Texas, and the southern tip of Florida; the Breadbasket, including the Great Plains states, and some of the Prairie provinces of Canada; the Islands, a federation of the Caribbean and also Greater Miami and the Keys; Mexamerica, a melange of Tex-Mex culture including northern Mexico, much of the southern US and New Mexico, part of California, and Texas; Ecotopia, Northwest U.S., including Alaska and British Columbia; Quebec including, well, Quebec; and, the Empty Quarter, the sparsely populated part of North America.
I thought about this important book when considering the Commonwealth Fund’s study and the two-America’s map. Healthcare and health outcomes have morphed the nine nations generally into two, a country of health have’s and have not’s blurring since 1981. Income-related health disparities continue to separate American health citizens, as do the presence of food deserts in a community, poor air quality, lack of transportation infrastructure, and in the contemporary era of social determinants through the THINK-Health/Health Populi lens, lack of access to broadband connectivity, especially in rural areas.
The ability to access broadband via a smartphone, increasingly common platform among lower income folks who have cut the cord to landline phones, means people can look for jobs and access information. For health, that access enables health citizens to sign up for health insurance, receive text messages for medication reminders, and access telehealth visits for healthcare and mental health counseling and support.
Congress will re-visit net neutrality in the coming weeks, which would be one way to address the connectivity-disparity for social determinants of health. Advancing mental health for all and reducing obstacles and taboos will also help improve the healthcare scorecard across states. Finally, balancing social care investments vis-a-vis capital-intensive healthcare spending is important to get to the heart of what’s wrong with U.S. healthcare.
 One of the best aspects of my work is collaborating across the health/care ecosystem to address how health citizens can deal with health care costs and and care for families. I'm grateful to have collaborated with Fidelity on their research into this issue,
  Jane joined host Dr. Geeta "Dr. G" Nayyar and colleagues to brainstorm the value of vaccines for public and individual health in this challenging environment for health literacy, health politics, and health citizen grievance.