
The level of medical debt in America exceeded debt of other types in 2020.
 Furthermore, the flow of medical debt was greater among health citizens living in states that did not expand Medicaid as part of the Affordable Care Act, compared with patients who reside in Medicaid expansion states, according to an original research essay, Medical Debt in the US, 2009-2020 published in JAMA on 20 July 2021.
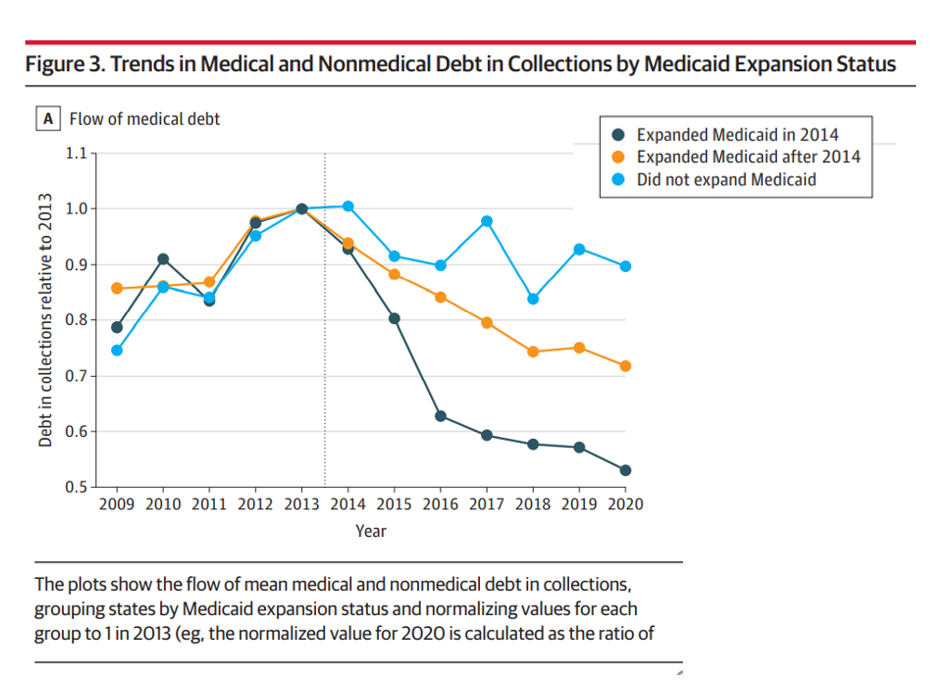
The first line chart illustrates the trends in medical debt in collections by state expansion of Medicaid, with the bottom darkest line representing debt in collections in Medicaid expansion states from the jump in 2014. Note that the line in 2020 nearly touches the x-axis, tending toward “zero,” or very scant medical debt.
Now, cast your eye up to the orange line, tying to debt in states that expanded Medicaid after 2014.
The highest turquoise blue line shows medical debt in collections in states that never expanded Medicaid with the ACA. In those states, medical debt far exceeded that accumulated by patients in states led by Governors who chose to grow Medicaid to cover the health care of their tax-paying health citizens.
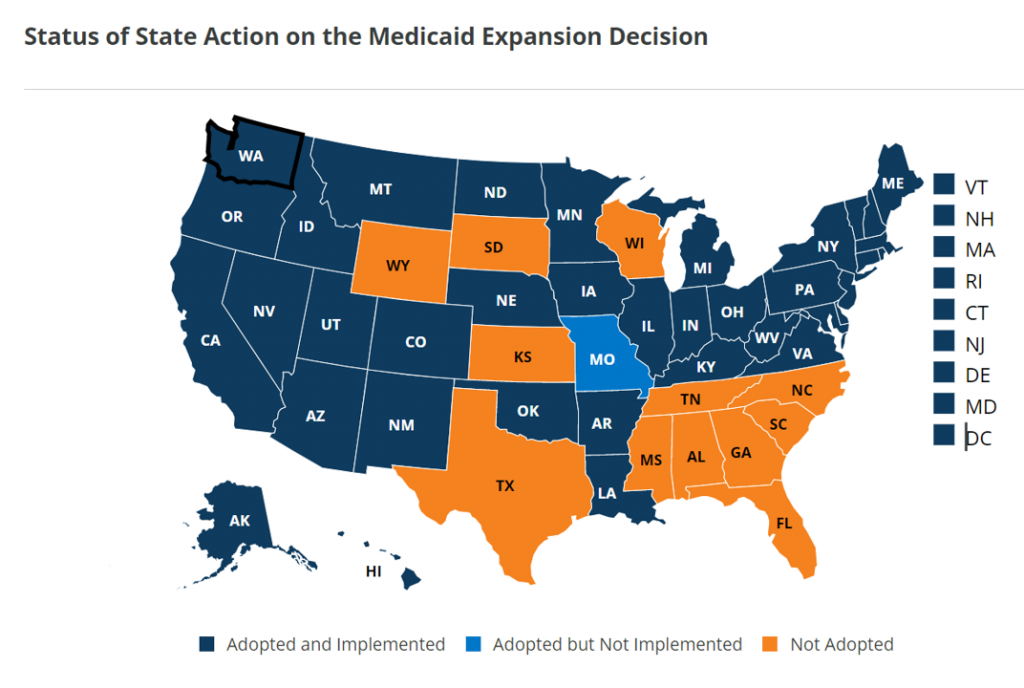 When we talk about the “Medicaid non-expansion” states, it’s helpful to call out who they are; this map comes from the Kaiser Family Foundation’s latest read on Medicaid expansions as of 9 July 2021 and include the 12 states of:
- Alabama
- Florida
- Georgia
- Kansas
- Mississippi
- North Carolina
- South Carolina
- South Dakota
- Tennessee
- Texas
- Wisconsin, and
- Wyoming.
A paper published in the National Bureau of Economic Research found that Medicaid expansion bolstered families’ financial wellness, reduced their risks of medical bankruptcy, and improved credit scores for those in expansion states.
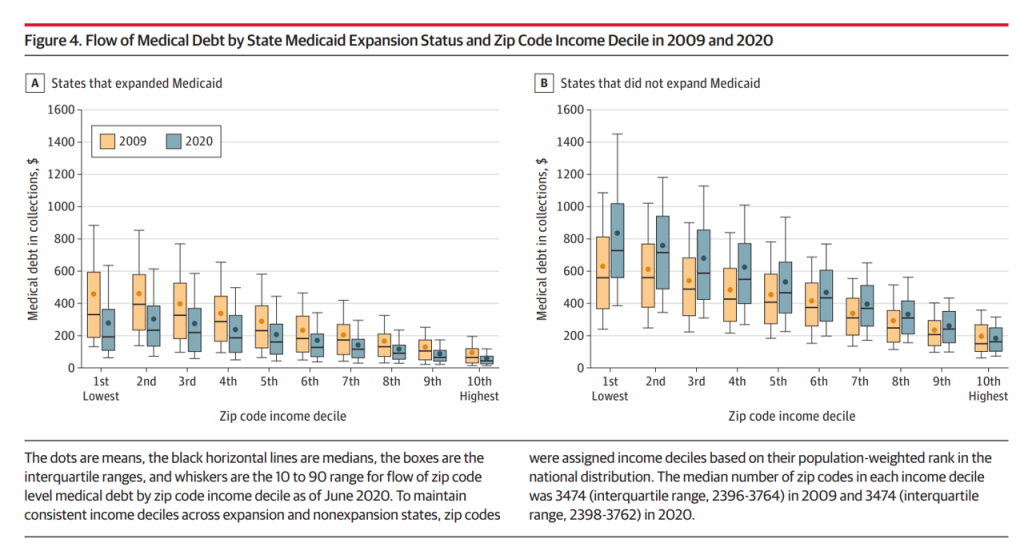 Next, check out a more granular look at medical debt by ZIP code income decile comparing 2009 and 2020, the latter after Medicaid expansion were implemented in 39 states.
The graph titled Figure 4 illustrates the ZIP code details by income decile and medical debt flows for the two years. The graph on the left analyzes States that expanded Medicaid, with the non-expansion States and debt flows shown on the right side.
It’s clear looking at the right-hand graph that patients living in States that did not expand Medicaid yielded much greater medical debt in both 2009 and 2020. This was dramatically greater in 2020 especially in the lowest-income ZIP codes.
Here are some specifics: In June 2020, about 18% of individuals had medical debt, with a mean amount of $429. This was highest in the South U.S. and lowest in the Northeast, a vast chasm between $616 and $167, respectively, from South to Northeast.
The point about Medicaid expansion is also important in decreasing the financial risk exposure to medical bankruptcy post ACA Medicaid expansion: in the expansion states, the gap in the mean flow of medical debt between the lowest and highest ZIP code income declines fell by $145, while the gap grew by $218 in non-expansion States.
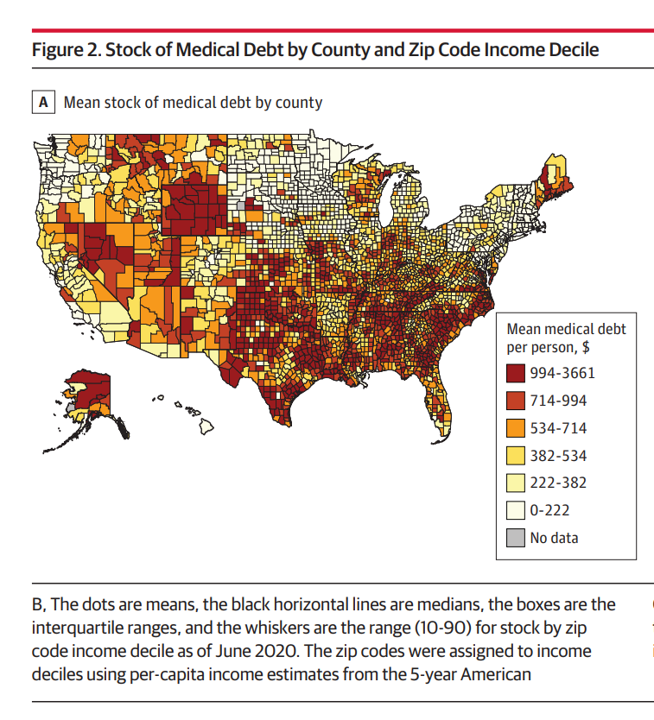
Health Populi’s Hot Points: This last map illustrates medical debt by county, making the point about where the largest concentration of mean medical debt per capita was in 2020.
The study’s bottom-line for health citizens is that, simply put, is that individuals in the lowest ZIP code income deciles in states that did not expand Medicaid and the highest levels of medical debt in the U.S. from 2009, and also had the largest increases in mean medical debt.
Let’s be clear here: medical debt in 2020 tended to be higher in poorer neighborhoods in the U.S. This is yet another example of health disparities and inequities in the U.S., this time measured by financial toxicity of health care costs especially for people living where Governors have chosen not to expand Medicaid to their states’ poorest health citizens.
As Benedic Ippolito of the American Enterprise Institute told the New York Times, “Debt collections agencies place very low odds on recovering these debts. If you had to choose between keeping the lights on and paying your mortgage and paying some doctor you’re never going to see again, I think a lot of us would make the same decision.”
 A lot of us also are covered by commercial health plans through our employers or purchased on health insurance marketplaces.
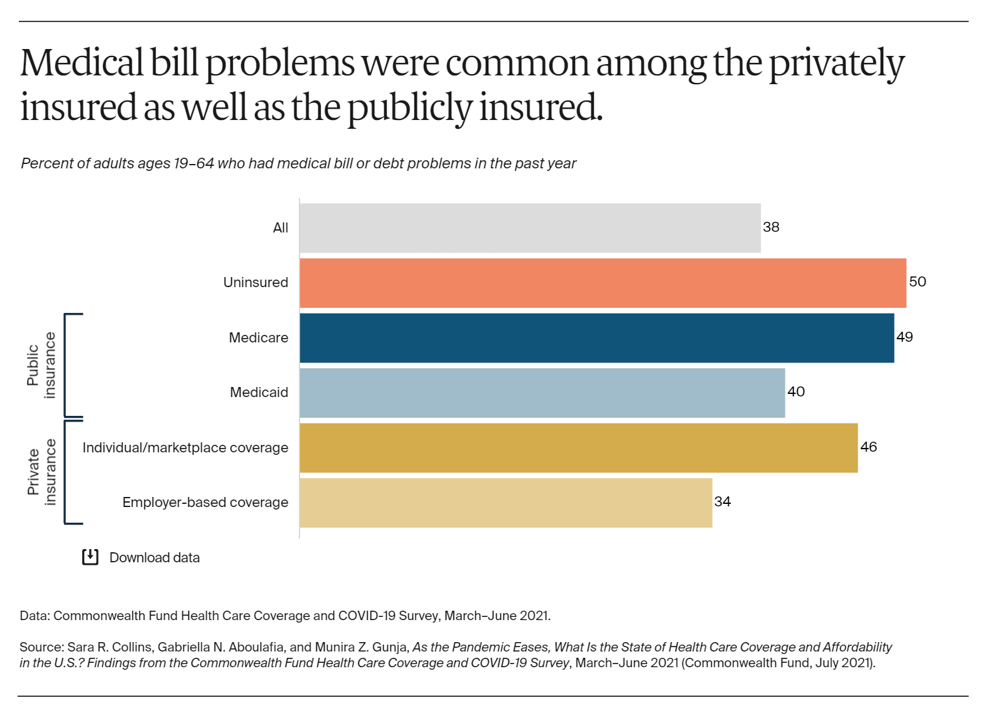
The Commonwealth Fund’s latest study published this week finds that medical bill problems have also been common among privately-insured Americans, shown in the bar chart.
The Fund surveyed U.S. adults’ health insurance coverage between March and June 2021, over a year into the COVID-19 pandemic, so assess how the public health crisis has impacted peoples’ health plan security in the wake of the coronavirus. While uninsured people had the most challenges dealing with medical bills, it’s striking to see that 36% of insured people had some medical bill or medical debt problem in the past year.
The bar chart shows that one-third of Americans with employer-based health coverage had medical bill or medical debt problems in the past year.
The Fund also learned that people who reported higher rates of problems with medical bills and debt were more likely to have lost income, tested positive or became sick with COVID-19, or lost health insurance coverage.
As the pandemic continues in its delta variant-endemic phase (some calling it a fourth-wave), we’ll have to expect continued financial toxicity as a side effect of COVID-19. In the U.S., we cannot separate the financial impact of COVID-19 from the medical in the context of our current health care financing system.
 Thank you
  Jane joined host Dr. Geeta "Dr. G" Nayyar and colleagues to brainstorm the value of vaccines for public and individual health in this challenging environment for health literacy, health politics, and health citizen grievance.