
 The bad news: mortality rates haven’t improved much and obesity rates rose in one-third of communities. The good news: public health gains can be made in resource-poor communities with the right health policies, based on research from The Commonwealth Fund, Rising to the Challenge, the Fund’s Scorecard on local health system performance for 2016.
The top-line of this benchmark report is that health care in the U.S. has, overall, improved more than it’s declined. Among the big levers driving health care improvement in the past year have been the further expansion of health citizens covered with insurance through the Affordable Care Act, more people getting needed care and a lower-percentage of people self-rationing due to cost, fewer hospital readmission said, and higher-quality care.
But underneath the macro positive view are some micro-factors that must be called out:
- An increase in the proportion of people who are obese in America
- Greater incidence of high-risk nursing home residents with pressure sores
- Challenges for many adults with a usual source of care, among others.
It’s also clear that more local health system improvements benefiting lower-income residents have been realized in those states that expanded Medicaid for the Affordable Care Act.
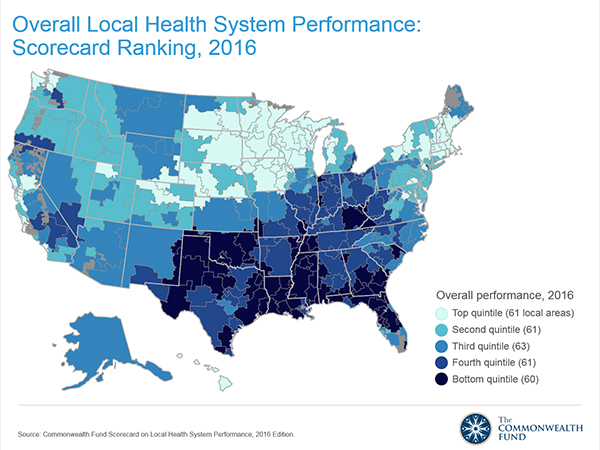
The darker-blue tones in the map illustrate the overall trends across states in health system performance for 2016. There’s a concentration of lower-performance in the south and southeastern states than in the north and northwest. I recently found similar trends for public health outcomes discussed in my Health Populi post discussing President Obama‘s column in the Journal of the American Medical Association (JAMA) on the progress of health reform.
Note, too, that within states there can be huge variation in health outcomes: in Michigan, for example, premature deaths from treatable conditions varied over 2x from a low of 64 deaths per 100,000 in Traverse City to a high of 142 deaths per 100,000 in Dearborn, a suburb of Detroit.
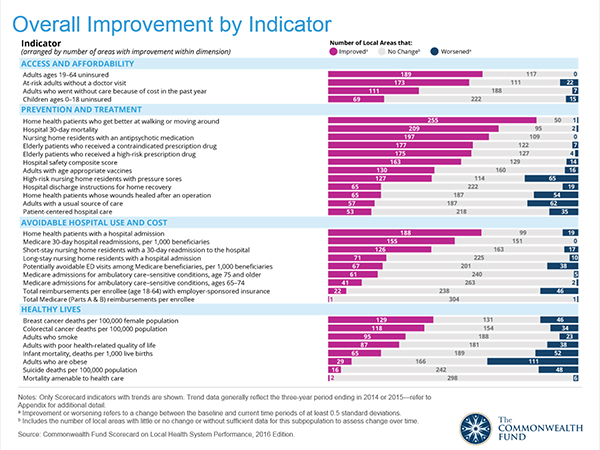 The Fund bases its annual community health Scorecard, launched in 2012, on four dimensions: access and affordability, prevention and treatment, avoidable hospital use and cost, and healthy lives. Details on these factors appear in the second (bar) chart on overall improvement by indicator. Under each of the indicators are specific indices of health system performance, such as level of uninsured and adults forgoing care due to cost (in access/affordability); hospital 30-day mortality and safety score (for prevention and treatment); hospital readmission said and avoidable ER visits (for avoidable hospital use and cost); and, breast cancer deaths per 100,000 people and adults who smoke (for healthy lives).
Health Populi’s Hot Points: The map and the health indicators, when put under the microscope of demographics and health system factors, point out the undeniable American reality that local health system performance is directly related to income. The Fund’s report points out that, “compared with residents of higher-income areas, those living in lower-income areas are more likely to report going without needed medical care because of cost (19% vs. 12%), more likely to receive a high-risk prescription medication (20% vs. 13% among Medicare enrollees),” among other health disparaties.
This makes the case for public policies that can address the root, base cause that lower income areas lay the ground for worse health outcomes and sustained health disparities.
One successful public policy, illustrated by the “access and affordability” factor, has been the Affordable Care Act. Note that the blue bars on the right side of the bar chart have relatively small numbers for “worsened” situation for the uninsured, at-risk adults without a doctor visit, and adults who went without care due to cost in the past year. These dimensions improved under the ACA and Medicaid expansion in the 31 States and District of Columbia whose governors did so.
On the other hand, see “healthy lives” and “prevention and treatment” indicators, where you find more blue bars of “worsened” situations for obesity, infant mortality, mortality amenable to health care, and adults with a usual source of care. Designing sound food and nutrition policies, expanding health education and education overall to promote literacy (general, health, digital, and financial), and supporting resilient local economies are the salvo to bolstering health outcomes and engaging health citizens for co-making health at home and in their communities.
 One of the best aspects of my work is collaborating across the health/care ecosystem to address how health citizens can deal with health care costs and and care for families. I'm grateful to have collaborated with Fidelity on their research into this issue,
  Jane joined host Dr. Geeta "Dr. G" Nayyar and colleagues to brainstorm the value of vaccines for public and individual health in this challenging environment for health literacy, health politics, and health citizen grievance.